geotrellis使用初探
最近,单位领导要求我研究一下geotrellis(GITHUB地址:https://github.com/geotrellis/geotrellis,官网http://geotrellis.io/),于是我只能接受这个苦逼的任务。
官网中写到:GeoTrellis is a geographic data processing engine for high performance applications.可以看出这个框架主要是用来进行地理信息数据的高性能快速处理,当然是个很有用的东西,但是怎么学习之,是个很大的问题。
Geotrellis主要涉及到的知识点包括Scala,sbt,Spark,Akka。貌似每项都不是善茬,基本都没有怎么接触过,除了Scala稍微接触过,那么只能完全从头开始学习了。
程序员第一步,百度之,Bing之,Google之,CnBlog之。完全找不到门路,可能是一个新的处理框架,基本没有人使用过,查不到任何有用的信息,怎么办?那只能自己摸索。
程序员第二步,自己摸索。
看了一下,geotrellis开源了一个例子(https://github.com/geotrellis/geotrellis-chatta-demo),我最喜欢先跑个例子看一下,这样好像自己已经牛逼的搞定了他,其实主要是能够从例子中可以大概明白他能干什么事情,然后以及一些具体的操作步骤。git clone到本地之后,傻眼了,怎么运行它。。。完全没有思路,看到sbt,那就开始学习sbt吧,sbt其实是相当于Maven的一个框架,能够帮我们管理scala项目,刚开始为了跑例子,也没有怎么研究,就是看到说直接到项目目录运行./sbt run即可,来来回回折腾了好多次每次都是error error,但是不要灰心,只需要一直./sbt run。过了一天时间,下载了一堆jar,成功跑了起来,出来了应有的效果,心中甚是欢喜,向领导汇报一下,领导看了一眼,又提了一堆记也没记住的问题让去研究,算是完成了第一步。
跑出来例子之后就反过来看他的github的ReadeME,上面有一项Hello Raster,就是对Geotrellis使用的一个简单的介绍,想着这个可以,如果能跑通,那应该就基本ok了。部署了Spark环境(参考之前的一篇文章使用Ambari安装hadoop集群),然后又研究了sbt,在Windows的笔记本上搭建了开发环境(IDEA+SCALA+SBT),这块网上的介绍也很多,不在这里介绍。然后把Geotrellis clone到本地,简单看了一下源码,发现比较高深,一筹莫展,打个jar包放到服务器上,运行spark-shell然后按照reademe中的步骤一步步来,无奈一直报错,根本不知道什么原因,其实这个时候对geotrellis根本还是云里雾里,不清楚到底怎么个情况。这个时候又回来看开源的那个geotrellis-chatta-demo,看着看着突然就顿悟了,这个demo其实干的是个很简单的事情,就是网页根据用户的交互信息向后台程序发请求,后台程序根据请求的数据用模型计算分析出一个信息(地理空间信息),并将数据发到前台,前台将此信息解析加载到地图上显示。明白了这一点就好办了,那么geotrllis主要完成的功能其实就是计算,根据你的需求进行相关计算,一下子就变得不是那么神秘了。然后我想既然spark-shell行不通,那么我为什么不直接把框架拿到本地做测试,刚好又发现了一个demo(https://github.com/geotrellis/geotrellis-sbt-template)是geotrellis的helloworld,clone本地之后运行,OK一切正常,然后将geotrellis项目中的Reademe中的东西拿来测试,OK跑通,心中甚是激动。
本篇博文主要记录了geotrellis框架的一个学习的过程,其实说是过程,也只是才完成了hello world,后面的东西还有很多。在这里主要总结一下学习的方法,为更深入的学习打好基础,也为同样学习此框架的人提供一个hello world一样的教程,少走弯路。
geotrellis使用(二)geotrellis-chatta-demo以及geotrellis框架数据读取方式初探
在上篇博客(geotrellis使用初探)中简单介绍了geotrellis-chatta-demo的大致工作流程,但是有一个重要的问题就是此demo如何调取数据进行瓦片切割分析处理等并未说明,经过几天的调试、分析、源代码研读终于大致搞明白了其数据调取方式,下面简单介绍。
经过调试发现系统第一次调用数据的过程就是系统启动的时候调用了initCache方法,明显可以看出此方法是进行了数据缓存,那必然牵扯到数据的调取,整个过程清晰明了,只新建了一个RasterSource类,并调用了相关方法。明显数据调取过程应当是使用了RasterSource类,RasterSource是一个object类,新建过程调用了其一个apply方法:
def apply(name: String): RasterSource =
RasterSource(LoadRasterDefinition(LayerId(name)), None)
此方法其实调用了另一个方法
def apply(rasterDef: Op[RasterDefinition], targetExtent: Option[RasterExtent]): RasterSource = {
val (rd, tileOps) =
targetExtent match {
case reOp @ Some(re) =>
( rasterDef.map(_.withRasterExtent(re)),
rasterDef.map { rd =>
Seq(LoadRaster(rd.layerId, reOp))
}
)
case None =>
( rasterDef,
rasterDef.map { rd =>
(for(tileRow <- 0 until rd.tileLayout.layoutRows;
tileCol <- 0 until rd.tileLayout.layoutCols) yield {
LoadTile(rd.layerId, tileCol, tileRow)
})
}
)
}
new RasterSource(rd, tileOps)
}
由此可以看出LoadRasterDefinition(LayerId(name))完成的就是获取一个Op[RasterDefinition]对象。
通过此方法经过N步的追踪之后终于在DataSource类中找到了这么一个方法
def getRasterLayer(name:String):Option[RasterLayer] = layers.get(name)
有戏,看方法名字就知道是获得栅格层,那么主要就在layers身上了,layers怎么来的呢,上面有定义
private def initDirectory(d:File) {
val skipDirectories = mutable.Set[String]()
for(f <- d.listFiles
.filter(_.isFile)
.filter(_.getPath.endsWith(“.json”))) {
// It’s a JSON file
// which may contain layer metadata,
// or we just ignore it.
RasterLayer.fromFile(f) match {
case Success(layer) =>
layers(layer.info.id.name) = layer
// Skip the tile directory if it’s a tiled raster.
layer match {
case tl:TileSetRasterLayer =>
skipDirectories.add(new File(tl.tileDirPath).getAbsolutePath)
case _ =>
}
case Failure(e) =>
System.err.println(s”[ERROR] Skipping ${f.getPath}: $e”)
}
}
// Recurse through subdirectories. If a directory was marked
// as containing a tile set, skip it.
for(subdir <- d.listFiles
.filter(_.isDirectory)
.filter(f => !skipDirectories.contains(f.getAbsolutePath))) {
initDirectory(subdir)
}
}
看到这个是不是就豁然开朗了,原来这里是直接扫描给定的文件夹下的所有json文件,那么这个路径是怎么传进来的呢?找了半天未能找到何时传入了d(即数据路径),不过改变demo中的data文件夹的名字发现报错,并未能成功加载数据,说明是某个地方传入了该文件夹,然后通过查找log发现是GeoTrellis类中报的错,通过分析可以看出其默认获取resource文件夹中的application.conf中的
geotrellis.catalog配置信息,该信息的值为data/catalog.json,此文件具体存在,其中内容如下
{
“catalog”: “Catalog of Chattanooga data”,
“stores”: [
{
“store”: “chatta:albers”,
“params”: {
“type”: “fs”,
“path”: “arg_albers”,
“cacheAll”: “yes”
}
},
{
“store”: “chatta:wm”,
“params”: {
“type”: “fs”,
“path”: “arg_wm”,
“cacheAll”: “yes”
}
}
]
}
由此可以看出该文件完成了Catalog类和DataSource类定义的实例,而上文中讲到框架正是通过此类来加载数据。
这应当就是GeoTrellis框架读取数据的方式,即在application.conf配置一个catalog.json文件的地址,然后在catalog.json文件记录具体的DataSource信息,通过此信息来获取数据。
通过分析使用GeoTrellis框架下的多个demo可以发现均有catalog的踪迹,这应当是GeoTrellis读取数据的机制,catlog具体的工作模式还需后续继续研读源代码。
本文讲的比较乱,只是读demo的一点心得,后续如果有更好的想法也会随时进行修改完善。
下一步准备在此demo的基础上实现实时切割dem数据进行显示,后续心得会在总结之后继续发布到博客中。
geotrellis使用(三)geotrellis数据处理过程分析
之前简单介绍了geotrellis的工作过程以及一个简单的demo,最近在此demo的基础上实现了SRTM DEM数据的实时分析以及高程实时处理,下面我就以我实现的上述功能为例,简单介绍一下geotrellis的数据处理过程。
一、原始数据处理
geotrellis支持geotiff的栅格数据(矢量数据还未研究),可以将geotiff直接缓存至hadoop框架下的Accumulo NOSQL数据库,并建立金字塔等,具体处理过程在geotrellis.spark.etl.Etl类中。具体代码如下:
1 def ingest[
2 I: Component[?, ProjectedExtent]: TypeTag: ? => TilerKeyMethods[I, K],
3 K: SpatialComponent: Boundable: TypeTag,
4 V <: CellGrid: TypeTag: Stitcher: (? => TileReprojectMethods[V]): (? => CropMethods[V]): (? => TileMergeMethods[V]): (? => TilePrototypeMethods[V])
5 ](
6 args: Seq[String], keyIndexMethod: KeyIndexMethod[K], modules: Seq[TypedModule] = Etl.defaultModules
7 )(implicit sc: SparkContext) = {
8 implicit def classTagK = ClassTag(typeTag[K].mirror.runtimeClass(typeTag[K].tpe)).asInstanceOf[ClassTag[K]]
9 implicit def classTagV = ClassTag(typeTag[V].mirror.runtimeClass(typeTag[V].tpe)).asInstanceOf[ClassTag[V]]
10
11 /* parse command line arguments */
12 val etl = Etl(args)
13 /* load source tiles using input module specified */
14 val sourceTiles = etl.load[I, V]
15 /* perform the reprojection and mosaicing step to fit tiles to LayoutScheme specified */
16 val (zoom, tiled) = etl.tile(sourceTiles)
17 /* save and optionally pyramid the mosaiced layer */
18 etl.save[K, V](LayerId(etl.conf.layerName(), zoom), tiled, keyIndexMethod)
19
重要的就是参数args,geotrellis根据不同的参数将数据进行不同的处理。具体的参数信息在https://github.com/geotrellis/geotrellis/blob/master/docs/spark-etl/spark-etl-intro.md
中均有介绍,这里介绍一些重要的配置。
1、–layoutScheme layoutScheme有tms和floating两种选项,如果用floating切瓦片的时候只有0层,切记这一点,因为调用瓦片的时候跟层有很大关系;用tms会建立金字塔。相当于用floating处理的就是原始数据只将数据切割成256*256的块,层为0(具体x、y编号不需要操心,geotrellis会自动计算),用tms会将数据从最大层(此最大层根据数据的分辨率计算得出)切到第一层,调用的时候直接根据层进行调用。
2、–pyramid 加上此参数在layoutScheme=tms的时候系统会建立金字塔
3、-I path=file:/.. 如果此处的路径为文件,则单独导入此文件,如果为文件夹,则一次将整个路径导入,并且会自动拼接,瓦片不会有缝隙,这一点非常漂亮,此处只能用漂亮来形容,geotrellis不但能够分布式瓦片切割,还能自动拼接,实在是漂亮。
4、–layer 此参数用于区分不同的数据,取数据的时候根据此项区分不同的数据。
通过简单的调用ingest方法就能进行分布式瓦片切割,不得不说geotrllis提供了很多强大的功能。
二、发起服务
要对外提供数据,系统首先要能够发起服务,geotrellis建立一个服务也很容易,只需要使用以下语句系统遍自动的在host和相应的port上发起服务。
1 IO(Http) ! Http.Bind(service, host, port)
具体路由信息需要在service类中定义。service类需要继承Actor方法,并覆盖父类的receive方法。
1 override def receive = runRoute(serviceRoute)
2
3 def serviceRoute = get {
4 pathPrefix(“gt”) {
5 pathPrefix(“tms”)(tms) ~
6 path(“geoTiff”)(geoTiff)
7 } ~
8 pathEndOrSingleSlash {
9 getFromFile(staticPath + “/index.html”)
10 } ~
11 pathPrefix(“”) {
12 getFromDirectory(staticPath)
13 }
14 }
以上就是建立了service的路由匹配表以及具体的控制器。当只请求IP及相应端口时会请求index.html,请求gt/tms时交给tms控制器,gt/geotiff交给geotiff控制器,其他会去匹配静态地址,如图片、
js、css等。
三、瓦片调用
调取数据最简单的方式就是显示瓦片。前端使用openlayer、leaflet均可。以leaftlet为例,在js中添加以下代码:
1 WOLayer = new L.tileLayer(server +
2 ‘gt/tms/{z}/{x}/{y}’, {
3 format: ‘image/png’,
4 });
5 WOLayer.addTo(map);
前台便会请求后台的tms控制器,tms控制器定义如下:
tms获取到请求的x、y、z、值,并从Accumulo中取出相应的瓦片交给leaftlet,leaflet将瓦片数据放到合适的位置,便完成了瓦片的加载,从Accumulo中取出瓦片的的大致代码如下:
1 val tile: Tile = tileReader.reader[SpatialKey, Tile](LayerId(LayerName, zoom)).read(key)
其中tileReader是一个AccumuloValueReader对象,很明显看出此对象是一个有关Accumulo的对象,其中包含Accumulo的用户密码等。LayerName就是上文中导入数据时候设置的layer参数对应的值。key是个SpatialKey对象,val key = SpatialKey(x, y),记录了瓦片x、y编号值。读到瓦片之后将数据发送到前台的代码如下:
1 respondWithMediaType(MediaTypes.`image/png`) {
2 val result = tile.renderPng().bytes
3 complete(result)
4 }
其实就是调用Tile类的renderPng方法,然后将Png数据转换成bytes发送到前端。
四、高级瓦片调用
当然如果只是简单的调用瓦片,那就没有必要非要使用geotrellis了,很多工具包括arcgis、tilemill等都包含此功能,使用geotrellis不仅是其基于Spark框架能分布式运行,而是geotrellis提供了强大的分布式计算能力,比如我们想要划定区域内的瓦片,而此区域不是标准的矩形,即不是请求完整的瓦片,这时候采用普通的框架很难完成,而采用geotrellis却得心应手,只需要使用以下代码即可:
1 val maskedTile = {
2 val poly = maskz.parseGeoJson[Polygon]
3 val extent: Extent = attributeStore.read[TileLayerMetadata[SpatialKey]](LayerId(LayerName, zoom), Fields.metadata).mapTransform(key)
4 tile.mask(extent, poly.geom)
5 }
其中maskz是前端想要显示内容的区域(Polygon),attributeStore是AccumuloAttributeStore对象,同样可以看出是一个操作Accumulo的对象,attributeStore主要完成的功能就是读取当前瓦片的extent即外接矩形范围。通过调用Tile类的mask方法将请求的polygon与extent做交集,只取相交的部分的数据,再将此数据发到前端,在前端便能看到只显示设定区域内瓦片的效果。
五、统计分析
如果只是进行区域内瓦片显示,明显意义也不大(哈哈,王婆卖瓜),geotrellis还能完成各种复杂的基于数据的统计分析(只有你想不到的,没有你做不到的)。比如我现在做的一个demo就是统计分析给定区域内(Polygon)的高程信息(包含最大值、最小值、平均值)。
首先将DEM数据使用Etl.ingest方法导入Accumulo,注意此时就可以将–layoutScheme设置为floating,这样就不需要建立金字塔,只取第0层数据即可,即节省存储空间、切割时间又保证数据的一致性。
1 val layerId = LayerId(layer, 0)
2 val raster = reader.read[SpatialKey, Tile, TileLayerMetadata[SpatialKey]](layerId)
3 val masked = raster.mask(polygon)
4 val mapTransform = masked.metadata.mapTransform
5 val maps = masked map { case (k: SpatialKey, tile: Tile) =>
6 val extent: Extent = mapTransform(k)
7 val hist: Histogram[Int] = tile.polygonalHistogram(extent, extent.toPolygon())
8
9 var max, min = hist.maxValue().getOrElse(0)
10 var count:Long = 0
11 var sum : Double = 0
12 hist.foreach((s1:Int, s2:Long) => {
13
14 if (max < s1) max = s1
15 if (min > s1) min = s1
16 sum += s1 * s2
17 count += s2
18 })
19 (max, min, sum, count)
20 }
21 val (max, min, sum, count) = maps reduce { case ((z1, a1, s1, c1), (z2, a2, s2, c2)) => (Math.max(z1, z2), Math.min(a1, a2), s1 + s2, c1 + c2) }
22 val avg = sum / count
val layerId = LayerId(layer, 0)表示取的是导入数据的第0层,由于使用floating方式此处必须是0。reader是一个AccumuloLayerReader对象,此处与上面的AccumuloVlaueReader不同之处在于上文中取固定key值得瓦片,此处需要根据范围进行选择,masked就是根据polygon筛选出的结果,是一个RDD[(SpatialKey, Tile)]对象,即存储着范围内的所有瓦片以及其编号信息。对masked进行map操作,获取其单个瓦片的extent,以及polygon内的统计信息,算出最大值,最小值以及高程加权和。最后对结果进行reduce操作,获取整体的最大值、最小值、平均值。(此处平均值算法可能不妥,希望有更好建议的能够留言,感激!)。将计算到的结果发到前端,前端就能实时显示统计分析结果。
六、结尾
geotrellis的功能非常强大,此处只是冰山一脚,后续还会进行相关研究,经验心得会及时总结到这里,以使自己理解的更加透彻,如果能帮助到其他人也是极好的!
geotrellis使用(四)geotrellis数据处理部分细节
前面写了几篇博客介绍了Geotrellis的简单使用,具体链接在文后,今天我主要介绍一下Geotrellis在数据处理的过程中需要注意的细节,或者一些简单的经验技巧以供参考。
一、直接操作本地Geotiff
如果不想将tiff数据切割成瓦片存放到集群中,也可以直接使用Geotrellis操作本地geotiff文件,可以直接使用SinglebandGeoTiff读取单波段的tiff,使用MultibandGeoTiff读取多波段tiff。
val geotiff = SinglebandGeoTiff(“data/test.tif”)
然后使用geotiff.tile就可以像处理普通瓦片那样处理整幅tiff图像。
二、Geotiff数据处理需要注意的细节
如果需要将geotiff数据切割并上传到集群首先需要处理的是geotiff的数据类型、无数据值等元数据信息,即前期处理数据的时候需要将tiff文件处理到合适的情况以方便在程序中使用。
与数据类型和无数据值相关的属性是Tile类的CellType,Geotrellis中定义了与各种类型相对应的CellType类型,具体在geotrellis.raster.CellType类中,当然程序中可以使用tile.convert(ShortConstantNoDataCellType)将瓦片的类型转换为其他形式。
三、获取瓦片编号或者瓦片的范围(Extent)
将数据上传到集群后,一般可以使用LayerReader将整层的瓦片信息全部读出,
val r = reader.read[SpatialKey, Tile, TileLayerMetadata[SpatialKey]](layerId)
其中reader为LayerRander的实例,可以是AccumuloLayerReader等,具体看用户将瓦片数据存放到什么位置,layerId是存放信息的实例,包含存放的layer名称以及第几层,然后就可以使用r.metadata.mapTransform函数获取
瓦片的范围或者瓦片的编号,如果该函数的参数是一个key(瓦片编号实例),结果就是瓦片的Extent,如果参数是一个point,算出来的就是包含该点的瓦片的key。
四、数据的重投影
程序中如果需要对tile进行点、线、面的相交取值等处理就必须使用与tile相同的投影方式,否则处理过程中会出现错误,可以使用ReProject首先对点、线、面进行重投影。
Reproject(geo, LatLng, WebMercator)
其中geo表示需要进行重投影的点、线、面,LatLng是原始投影方式,WebMercator是需要转换到的投影方式。Geotrellis中定义了一个CRS类用于记录投影信息。LatLng和WebMercator继承了CRS类,是定义好的4326和3857投影方式,其他投影类型可以使用CRS类中提供的fromEpsgCode等方法进行设置。
五、获取某个坐标点对应的值
如果我们想要获取某个坐标点所对应的数据的值,有两种方式,第一种是使用LayerReader先读取整层瓦片信息,然后根据偏移得到改点的值,具体方法如下:
val r = reader.read[SpatialKey, Tile, TileLayerMetadata[SpatialKey]](layerId)
val mapTransform = r.metadata.mapTransform
val key = r.metadata.mapTransform(point)
val dataValues: Seq[Double] = r.asRasters().lookup(key).map(_.getDoubleValueAtPoint(point))
val value = if(dataValues == null || dataValues.length <= 0) 0 else dataValues.head
其中reader和layerId的意义与上文相同,同样key就是根据坐标点的偏移算出的瓦片坐标,然后在所有瓦片中查找此key并且获取该坐标点的值,若多个瓦片均包含该坐标点会获取多个值,取出第一个。
第二种方式是使用ValueReader直接找到包含改点的瓦片,然后根据偏移得到此点的数据,具体代码如下:
val key = attributeStore.readMetadata[TileLayerMetadata[SpatialKey]](layerId).mapTransform(point)
val (col, row) = attributeStore.readMetadata[TileLayerMetadata[SpatialKey]](layerId).toRasterExtent().mapToGrid(point)
val tile: Tile = tileReader.reader[SpatialKey, Tile](layerId).read(key)
val tileCol = col – key.col * tile.cols
val tileRow = row – key.row * tile.rows
println(s”tileCol=${tileCol} tileRow = ${tileRow}”)
tile.get(tileCol, tileRow)
其中attributeStore是元数据信息,与用户数据上传的位置有关,key是从元数据中根据坐标点偏移算出的瓦片编号,tilReader是ValueReader实例,col、row是根据偏移算出的坐标点在整个数据集中的像素偏移值,然后通过减去编号乘以瓦片像素个数来获取相对当前瓦片的偏移,从而实现获取当前坐标点的数据值。
两种方式均能得到坐标点对应的值,但是其效率却相差几十倍,在我自己的测试中,使用ValueReader取到数据值大概需要20ms,而使用layerReader则大概需要6000ms,我猜测应当是使用LayerReader的方式会在所有瓦片中lookup,而ValueReader则直接获取单个瓦片,所以效率存在差别。
六、结束语
本文简单记录了近期使用Geotrellis过程中遇到的一些问题,及其解决方案,目前项目只用到了栅格数据,所以只是针对Raster模块,后续会探索其他模块功能,并随时将心得发布到博客园中,欢迎大家共同探讨。
geotrellis使用(五)使用scala操作Accumulo
要想搞明白Geotrellis的数据处理情况,首先要弄清楚数据的存放,Geotrellis将数据存放在Accumulo中。
Accumulo是一个分布式的Key Value型NOSQL数据库,官网为(https://accumulo.apache.org/),在使用Ambari安装hadoop集群一文中已经介绍了如何安装Hadoop集群以及Accumulo。
Accumulo以表来分区存放数据,结构为Key Value,其中Key又包含RowID和Column,Column又包含Family、Qualifier、Visibility。
闲话莫谈,首先介绍一下如何在accumulo shell中操作Accumulo。
1、进入accumulo shell控制台
accumulo shell -u [username]
username就是具有操作accumulo的用户
2、查看所有表
tables
3、创建表
createtable mytable
4、删除表
deletetable mytable
5、扫描表,查看数据
scan
6、插入数据 插入数据的时候要在当前表的工作域中
insert row1 colf colq value1
只要rowID family qualifier有一个不重复即可,如果重复会覆盖掉原来的value。
7、切换表
table mytable
下面介绍一下如何使用Scala语言操作Accumulo,也比较简单,先贴出全部代码
1 object Main {
2
3 val token = new PasswordToken(“pass”)
4 val user = “root”
5 val instanceName = “hdp-accumulo-instance”
6 val zooServers = “zooserver”
7 val table = “table”
8
9 def main(args: Array[String]) {
10 // write
11 read
12 }
13
14 def read = {
15 val conn = getConn
16 val auths = Authorizations.EMPTY// new Authorizations(“Valid”)
17 val scanner = conn.createScanner(table, auths)
18
19 val range = new org.apache.accumulo.core.data.Range(“row1”, “row2″) // start row — end row 即row ID
20 scanner.setRange(range)
21 // scanner.fetchColumnFamily()
22 // println(scanner.iterator().next().getKey)
23 val iter = scanner.iterator()
24 while (iter.hasNext){
25 var item = iter.next()
26 //Accumulo中数据存放在table中,分为Key Value,其中Key又包含RowID和Column,Column包含Family Qualifier Visibility
27 println(s”key row:${item.getKey.getRow} fam:${item.getKey.getColumnFamily} qua:${item.getKey.getColumnQualifier} value:${item.getValue}”)
28 }
29 // for(entry <- scanner) {
30 // println(entry.getKey + ” is ” + entry.getValue)
31 // }
32 }
33
34 def write {
35 val mutation = createMutation
36 val writer = getWriter
37 writer.addMutation(mutation)
38 // writer.flush()
39 writer.close
40 }
41
42 def createMutation = {
43 val rowID = new Text(“row2”)
44 val colFam = new Text(“myColFam”)
45 val colQual = new Text(“myColQual”)
46 // val colVis = new ColumnVisibility(“public”) //不需要加入可见性
47 var timstamp = System.currentTimeMillis
48 val value = new Value(“myValue”.getBytes)
49 val mutation = new Mutation(rowID)
50 mutation.put(colFam, colQual, timstamp, value)
51 mutation
52 }
53
54 def getConn = {
55 val inst = new ZooKeeperInstance(instanceName, zooServers)
56 val conn = inst.getConnector(“root”, token)
57 conn
58 }
59
60 def getWriter() = {
61 val conn = getConn
62 val config = new BatchWriterConfig
63 config.setMaxMemory(10000000L)
64 val writer: BatchWriter = conn.createBatchWriter(table, config)
65 writer
66 }
67 }
以上代码主要实现了Accumulo的读写操作,其中zooServers是安装的zookeeper的主节点地址。instanceName是accumulo的实例名称。read的Range实现了范围内查找,但是此处的范围需要输入的是RowID的起始值,由于Accumulo是自动排序的,所以此处输入范围会将该范围内的数据全部返回。其他代码均通俗易懂(自认为,哈哈),所以不在这里赘述。
本文简单介绍了Accumulo的操作,仅是为了方便理解Geotrellis的工作原理以及阅读Geotrellis的源代码做准备,若是有人恰好需要将数据存放到集群中,不妨可以试一下存入到Accumulo中。
geotrellis使用(六)Scala并发(并行)编程
本文主要讲解Scala的并发(并行)编程,那么为什么题目概称geotrellis使用(六)呢,主要因为本系列讲解如何使用Geotrellis,具体前几篇博文已经介绍过了。我觉得干任何一件事情基础很重要,就像当年参加高考或者各种考试一样,老师都会强调基础,这是很有道理的。使用Geotrellis框架的基础就是Scala和Spark,所以本篇文章先来介绍一下Scala编程语言,同样要想搞明白Scala并发(并行)编程,Scala基础也很重要,没有Scala语言基础就谈不上Scala并发编程也就更谈不上使用Geotrellis或者Spark,本文先简单介绍一下Scala基础知识,这方面的书籍或者文章很多,大家可以网上找一下。
一、Scala基础
关于Scala基础最主要的就是模式匹配,这造就了整个Scala语言灵活方便的特点,通俗的说模式匹配就是其他语言中的switch case,但是其实功能要远远复杂的多,涉及到样本类(case class)、unapply函数等具体网上有很多介绍。其次还有强大的for表达式、偏函数、隐式转换等,下面主要为大家介绍Scala并发(并行)编程。
二、SBT简介
使用Scala语言编程,最好使用SBT框架,可以自动帮你完成包管理等,相当于java中的maven,下面先简单介绍一下SBT基础。
首先安装SBT,很简单,只需要下载安装包即可(http://www.scala-sbt.org/release/docs/Installing-sbt-on-Windows.html),具体安装过程以及配置等,大家也可以在网上找的到。安装完成之后,在IDEA中安装sbt插件,然后选择创建SBT项目,与普通Scala语言最主要的不同是会创建一个build.sbt文件,这个文件主要记录的就是项目的依赖等,要添加依赖就可以添加如下两行代码:
libraryDependencies += “com.typesafe.akka” % “akka-actor_2.11” % “2.4.4”
resolvers += “Akka Snapshot Repository” at “http://repo.akka.io/snapshots/”
其实build.sbt文件是一个被SBT直接管理的scala源文件,里面的语句均要符合Scala语法,其中libraryDependencies和resolvers 是定义好的Key,+= % at等都是写好的方法。libraryDependencies是存储系统依赖的Key,该语句添加了一个ModuleID对象,”com.typesafe.akka”为groupID,”akka-actor_2.11″为artifactID,2.4.4″为revision,%方法最终就创建了一个ModuleID对象,此处需要注意_2.11表示当前的Scala版本。resolvers表示系统如何能够找到上面的libraryDependencies,at 方法通过两个字符串创建了一个 Resolver 对象,前者为名称,后者为地址。一般lib的官网中均会有写明自己的上述语句供使用者方便添加自己lib依赖。
三、并发编程
下面为大家介绍如何使用Scala进行并发编程。
1、原生支持
Scala语言原生支持并发编程,只需要使类继承scala.actors.Actor即可,复写父类的act方法,也可以直接建立一个匿名类,直接使用actor{}即可,其中receive是一个偏函数,用于接收并处理其他Actor发送的消息,这里就用到了模式匹配,可以根据不同的消息类型进行不同的处理,相当于路由。
1 object ActorTest2 extends App {
2 val actor_a: Actor = actor{
3 while (true){
4 receive {
5 case msg => println(“actor_a ” + msg)
6 }
7 }
8 }
9
10 val actor_b = actor{
11 while (true){
12 receive {
13 case msg => {
14 println(“actor_b ” + msg)
15 actor_a ! “b —- >>> a”
16 sender ! “receive ” + msg
17 }
18 }
19 }
20 }
21
22 actor_a ! “wsf”
23 actor_b ! Math.PI
24 }
上面的代码定义了两个Actor对象actor_a,actor_b,采用此种方式Actor会自动start,然后在主线程中各向每个Actor发送了一条信息,Actor接收到信息后进行简单的打印操作。由于Scala已经废弃了此种方式来进行并发编程,在这里也只是简单介绍,下面我们来看一下如何通过使用akka来进行并发编程。
2、akka
akka是一个简单易用的Scala并发编程框架(网址:http://akka.io/),其宗旨就是”Build powerful concurrent & distributed applications more easily.”。引入akka只需要在build.sbt文件中添加在SBT操作一节中介绍的代码即可,但是要根据自己的Scala版本以及要使用的akka版本进行修改。添加完之后IDEA会自动去下载akka的actor包。其使用基本与原生actor相同,同样创建一个类继承akka.actor.Actor,复写其receive方法。其代码如下:
1 class MyActor extends Actor{
2 override def receive={
3 case message: String=> println(message)
4 case _ => unhandled()
5 }
6 }
与原生Actor不同的是akka为其Actor加入了path的概念,即每个Actor都有一个绝对路径,这样系统首先要创建一个system,然后在system创建其下的Actor,代码如下:
val system = ActorSystem(“akkatest”)
val actor = system.actorOf(Props(classOf[wsf.akkascala.MyActor]), “akkaactor”)
其中ActorSystem(“akkatest”)即创建一个akka的system,用于管理Actor,第二句就是在system中创建一个上面MyActor实例。通过打印actor.path可以得到akka://akkatest/user/akkaactor,可以看出该Actor确实是在system之下,其中user表示是用户自定义Actor。
Actor实例创建之后无需start,会自动启动,可以使用actor ! “hello actor”语句来向actor发送消息,MyActor的receive方法接收到该语句之后进行模式匹配,如果能够匹配上就行进行相应的处理。
由于Actor具有了路径,其也就能够创建属于自己的Actor实例,只需要在当前Actor类中添加如下代码:
val otherActor = context.actorOf(Props(classOf[OtherActor]), “otheractor”)
其中OtherActor是定义好的另一个Actor,打印otherActor.path可以得到如下效果:akka://akkatest/user/akkaactor/otheractor,这就表明确实在MyActor中创建了一个子Actor。MyActor就可以管理OtherActor的实例。
以上介绍了akka的并发编程,其并行编程要稍作修改。
首先建立一个RemoteActor项目,将build.sbt中项目的引用改为libraryDependencies ++= Seq(“com.typesafe.akka” % “akka-actor_2.11” % “2.4.4”,”com.typesafe.akka” % “akka-remote_2.11” % “2.4.4”),可以看出相比普通Actor项目只是添加了一个akka-remote引用。然后新建一个RemoteActor类同样继承自Actor,与普通Actor毫无区别。然后创建一个主类启动该Actor。唯一需要注意的就是要在resources文件夹中新建一个application.conf文件,该文件是系统的配置文件,里面添加如下代码:
1 akka {
2 loglevel = “INFO”
3 actor {
4 provider = “akka.remote.RemoteActorRefProvider”
5 }
6 remote {
7 enabled-transports = [“akka.remote.netty.tcp”]
8 netty.tcp {
9 hostname = “127.0.0.1”
10 port = 5150
11 }
12 log-sent-messages = on
13 log-received-messages = on
14 }
15 }
主要定义使用tcp协议的方式进行数据传输,端口是5150。这样就完成了remoteActor的定义。
然后新建一个LocalActor项目,同样修改build.sbt文件中的内容如上,然后新建一个LocalActor类,由于此处需要向RemoteActor发送消息,所以必须建立一个RemoteActor的子Actor,具体命令如下:
val remoteActor = context.actorSelection(“akka.tcp://remoteSys@127.0.0.1:5150/user/remoteactor”)
其中akka://remoteSys/user/remoteactor是RemoteActor通过system创建的路径,此处与之不同的是akka后添加.tcp表示通过tcp方式创建然后就是remoteSys后通过@127.0.0.1:5150指定远程actor的IP地址以及端口。这样就可建立一个remoteActor的实例,可以通过该实例向remoteActor发送消息。
LocalActor中也需要添加application.conf文件,但是只需要添加如下语句即可:
1 akka {
2 actor {
3 provider = “akka.remote.RemoteActorRefProvider”
4 }
5 }
四、总结
本文为大家简单介绍了scala基础、sbt简单操作、原生actor、akka的并发以及并行方式actor,这些是我在学习Geotrellis的过程中学习基础知识的一部分经验总结和梳理,只有打好基础才能更好的拓展自己的知识。要知其然并知其所以然。明白了这些对阅读Geotrellis源代码以及Spark源代码都会有很大的帮助。
geotrellis使用(七)记录一次惨痛的bug调试经历以及求DEM坡度实践
眼看就要端午节了,屌丝还在写代码,话说过节也不给轻松,折腾了一天终于解决了一个BUG,并完成了老板安排的求DEM坡度的任务,那么就分两段来表。
一、BUG调试
首先记录一天的BUG调试,简单copy了之前写好的代码(在前面几篇博客中已有介绍),然后添加了求坡度的代码,坡度代码暂且不表,然后满怀欣喜的上线,打开浏览器访问,以为节前的工作就可以告一段落了,谁知一天的辛苦就此拉开序幕——竟然空白一片,什么都没有,怎么会没有瓦片,难道数据没有导入,对spark集群各种检查,accumulo数据库检查,都没有问题。然后打开浏览器的开发者模式,看瓦片请求情况,确实是有问题,不是数据的问题,而是请求的问题,单独请求一个瓦片能够得到一堆数据,明显是瓦片文件的byte数组,因为瓦片处理的代码就是返回瓦片文件的byte数组,代码如下:
respondWithMediaType(MediaTypes.`image/png`) {
val result =
timedCreate(
“tms”,
“ChattaServiceActor(211)::result start”,
“ChattaServiceActor(211)::result end”) {
maskedTile.renderPng(ramp).bytes
}
printBuffer(“tms”)
complete(result)
}
响应代码跟以前一模一样没有任何改变,怎么就不行了呢,再看请求发现响应头貌似有点不对劲,Content-Type为image/png;charset=utf-8。这是什么鬼,怎么变成了image/png;charset=utf-8,明显是文本的嘛,那为什么变成这样了呢,各种折腾,连fiddler的改script都用上了,即使修改content-type也还是不行,什么原因。研究半天无果,程序员三大法宝之二,重启服务器,重启系统,启动spark集群,启动程序,再试之,依然不行,崩溃。。。
眼看幸福的节日就要到了,无招了,那就问大神吧,English是硬伤,这里就截个屏。权当笑料。
大神就是大神啊,居然能够清晰的理解了我的这破烂不堪的英语,经过半个多小时的交流(中间顺便吃了个饭),居然一针见血的指出了我的问题,这里面牵扯到Scala语言一个叫隐式转换的东西,我把import DefaultJsonProtocol._放在了最前面,这直接导致程序将瓦片的byte数据隐式转成了json,该语句应该出现在需要将数据转为json的地方。所以前台死活都显示不出来图片,再简单完善了一下代码,愉快的开始了假期模式。
看似写的轻松的BUG调试,其实真是费了不少劲,当然中间也收获了很多东西,总体来说回忆起来还是个比较愉快的过程,做一件事情只有保持不达目地决不罢休的态度方能有所突破。下面再来简单表一下求DEM的坡度。
二、求瓦片坡度
其实这个就非常简单了,只需要将DEM数据先导入到accumulo中(参考geotrellis使用(三)geotrellis数据处理过程分析以及geotrellis使用(四)geotrellis数据处理部分细节),然后根据前端调用的瓦片SpatialKey,读取该瓦片,之后使用
tile.slope(getMetaData(LayerId(LayerName, zoom)).layout.cellSize, 1.0, None)
即完成了计算此瓦片的坡度,这句代码调用了Geotrelis框架的Slope类,计算瓦片坡度并返回。
三、总结
以上主要记录了今天工作中的问题和解决方案,主要完成了一个bug调试以及生成DEM瓦片坡度,以方便以后查阅。这里还要对赵老师表示歉意,因为刚开始发现content-type多加了charset的时候以为是服务器配置被改变的原因,令赵老师也跟着查找了半天原因,同时也对包总表示感激,也陪着调试了半天,同时也对国外友人严谨、负责、友好的态度表示感谢。最后,祝大家节日愉快!
geotrellis使用(八)矢量数据栅格化
目录
- 前言
- 栅格化处理
- 总结
- 参考链接
一、前言
首先前几天学习了一下Markdown,今天将博客园的编辑器改为Markdown,从编写博客到界面美观明显都清爽多了,也能写出各种样式的东西了,有关Markdown,网上内容很多,暂且不表,开始进入今天的主题。
前几天碰到一个任务,需要将矢量数据导入到Accumulo中,然后通过geotrellis进行调用。这一下又犯难了,之前处理的全是raster数据,通过ETL类可以直接进行导入生成金字塔等,如何将矢量数据导入平台之前未曾碰到,但是大致分析首先需要进行栅格化,因为栅格化之后就可以直接使用Geotrellis进行处理,矢量数据栅格化之前也未遇到过,解决问题就要一步步来,一步步分析,下面就为大家讲解我本次实现的过程。
二、栅格化处理
要想栅格化第一步肯定需要读取矢量数据。
读取矢量数据
本文中主要讲解shapefile,数据库部分后面讲解。
首先浏览Geotrellis的源代码,发现一个ShapeFileReader类,貌似直接能解决问题啊,赶紧写代码如下:
geotrellis.shapefile.ShapeFileReader.readSimpleFeatures(path)
满心欢喜的以为一句话就解决问题了,谁知道一直报如下错误:
The following locker still has a lock: read on file:..shp by org.geotools.data.shapefile.shp.ShapefileReader
The following locker still has a lock: read on file:..shx by org.geotools.data.shapefile.shp.IndexFile
The following locker still has a lock: read on file:…dbf by org.geotools.data.shapefile.dbf.DbaseFileReader
Exception in thread “main” java.lang.IllegalArgumentException: Expected requestor org.geotools.data.shapefile.dbf.DbaseFileReader@4ea5b703 to have locked the url but it does not hold the lock for the URL
实验了各种方法无果,那么看一下他的源代码,然后直接拿过来用,发现可以,代码如下:
/**
* get the features from shape file by the attrName,default “the_geom”
* @param path
* @return mutable.ListBuffer[Geometry]
*/
def getFeatures(path: String, attrName: String = “the_geom”, charset: String = “UTF-8”): mutable.ListBuffer[Geometry] ={
val features = mutable.ListBuffer[Geometry]()
var polygon: Option[MultiPolygon] = null
val shpDataStore = new ShapefileDataStore(new File(path).toURI().toURL())
shpDataStore.setCharset(Charset.forName(charset))
val typeName = shpDataStore.getTypeNames()(0)
val featureSource = shpDataStore.getFeatureSource(typeName)
val result = featureSource.getFeatures()
val itertor = result.features()
while (itertor.hasNext()) {
val feature = itertor.next()
val p = feature.getProperties()
val it = p.iterator()
while (it.hasNext()) {
val pro = it.next()
if (pro.getName.getLocalPart.equals(attrName)) {
features += WKT.read(pro.getValue.toString) //get all geom from shp
}
}
}
itertor.close()
shpDataStore.dispose()
features
}
实验中的shape文件包含一个字段the_geom,里面存储了空间信息的WKT语句,所以程序中读出该属性的值然后使用WKT.read(pro.getValue.toString)将其转换成Geometry对象。
注意最后需要添加shpDataStore.dispose()否则会同样报上述文件锁定的错误,所以我猜测此处应该是Geotrellis的一个bug。
通过上述可以得出其实通过数据库读取矢量数据也只是个驱动的问题,只要将需要的记录逐行读出然后转化为Geometry对象即可,后面会通过一篇博客详细说明。
读出了矢量数据后,紧接着就是将数据映射到栅格图像上。
将Geometry数组对象进行栅格化
获取Geometry数组对象的空间范围RasterExtent
栅格化后的数据仍然包含了投影、空间范围等空间信息以及分辨率、图像尺寸等栅格信息,所以我们要先根据Geometry数组求出这些信息。
一个简单的循环遍历所有要素比较最大最小值的方法,代码如下:
var minX = features(0).jtsGeom.getEnvelopeInternal.getMinX
var minY = features(0).jtsGeom.getEnvelopeInternal.getMinY
var maxX = features(0).jtsGeom.getEnvelopeInternal.getMaxX
var maxY = features(0).jtsGeom.getEnvelopeInternal.getMaxY
for (feature <- features) {
if (feature.jtsGeom.getEnvelopeInternal.getMaxX > maxX)
maxX = feature.jtsGeom.getEnvelopeInternal.getMaxX
if (feature.jtsGeom.getEnvelopeInternal.getMaxY > maxY)
maxY = feature.jtsGeom.getEnvelopeInternal.getMaxY
if (feature.jtsGeom.getEnvelopeInternal.getMinX < minX)
minX = feature.jtsGeom.getEnvelopeInternal.getMinX
if (feature.jtsGeom.getEnvelopeInternal.getMinY < minY)
minY = feature.jtsGeom.getEnvelopeInternal.getMinY
}
栅格图像包含分辨率、像素大小、cols、row等要素,在这里我简单的理解为可以根据矢量数据的经纬度范围差除以分辨率来得到cols、rows,通过查阅资料可以发现当zoom(表示瓦片的层级)为22时,分辨率为0.037323,所以这里可以简单的算出其他层级的分辨率如下:
val resolution = 0.037323 * Math.pow(2, 22 – zoom)
得到了分辨率后即可用范围差除以分辨率得到图像尺寸。
此处需要注意图像的空间参考,若参考不同时需要进行投影转换:val res1 = Reproject((minX, minY), LatLng, WebMercator)
RasterExtent(new Extent(minX, minY, maxX, maxY), cols, rows)
栅格化
经过查阅Geotrellis的源代码以及咨询官方大牛,大概明白了可以使用Rasterizer类进行栅格化操作,其实也很简单,只需要一句代码如下:
Rasterizer.rasterizeWithValue(features, re, 100)
其中features即从shp文件中读出的Geometry数组,re为上文中得到的RasterExtent,100表示将这些对象在栅格中赋予的像素值。
栅格化效果如下:
矢量数据
栅格化数据
三、总结
通过以上代码便完成了栅格化操作,看似没几行代码,确确实实也折腾了很久,主要是对Geotrellis的源代码还不够熟悉,对一些基础的地理空间信息知识掌握还不够到位。
geotrellis使用(九)使用geotrellis进行栅格渲染
目录
- 前言
- 图像渲染
- 总结
- 参考链接
一、前言
前面几篇文章讲解了如何使用Geotrellis进行数据处理、瓦片生成等,今天主要表一下如何使用Geotrellis进行栅格渲染。
昨日完成了两种数据叠加生成瓦片的工作,然而在进行瓦片渲染的时候始终得不到想要的漂亮的颜色效果,由于这块代码是从之前Geotrellis官方DEMO中拷贝过来的,从未进行深究,所以折腾半天也没能实现,无奈那么就看源代码吧,在源代码中找到了这样一篇文档(rendering.md),里面详细讲述了在系统中如何直接使用Geotrellis进行渲染。本文在对其翻译的基础上,添加自己的部分心得。
二、图像渲染
在上一篇文章中讲述了如何进行矢量数据栅格化操作,以及geotrellis使用(三)geotrellis数据处理过程分析中讲解了如何将geotiff数据导入Accumulo中进行调用,这里不再讲述这些,直接讲解如何对Tile进行渲染,说白了就是如何使用renderPng方法,当然你也可以使用renderJpg,二者基本相同。
最简单的渲染方式
最简单的方式就是直接使用下述代码:
tile.renderPng
其中tile表示一个瓦片实例,下文相同。
看似简单的代码,其实也不是那么简单,这里需要注意的就是tile的数据值必须为颜色值才能得到正确的颜色显示,这里就简单讲解一下Geotrellis中的颜色值。
Geotrellis中包含两个颜色类,RGBA和RGB,其中RGB表示普通的颜色、RGBA表示附加了透明度的颜色值。二者均用int类型进行表示,例如0xFF0000FF,前两位表示R值,紧接着两位表示G值,再后面两位表示B值,如果是RGBA模式,则还有两位表示A值。所以上述瓦片的数据类型必须为int32,然后为不同的点赋不同的颜色值,即可渲染成一个漂亮的瓦片。
使用ColorMap类
直接使用上述方式看似简单,其实比较麻烦,不易操作,因为要将瓦片数据值转成不同的颜色值,Geotrellis完全考虑到了这一点,为我们定义了一个ColorMap类,能够帮助我们实现瓦片值与颜色值之间的映射。使用方法如下:
val colorMap = ColorMap(…)
tile.renderPng(colorMap)
那么如何定义一个ColorMap实例呢?其实也很简单,只需要传入一个数据值和颜色值对应的Map对象即可。代码如下:
val colorMap =
ColorMap(
Map(
3.5 -> RGB(0,255,0),
7.5 -> RGB(63,255,51),
11.5 -> RGB(102,255,102),
15.5 -> RGB(178,255,102),
19.5 -> RGB(255,255,0),
23.5 -> RGB(255,255,51),
26.5 -> RGB(255,153,51),
31.5 -> RGB(255,128,0),
35.0 -> RGB(255,51,51),
40.0 -> RGB(255,0,0)
)
)
上述就可以得到一个ColorMap对象,其中数据在[-∞, 3.5]之内的都将对应成RGB(0,255,0)的颜色,(3.5, 7.5]之内的都将对应成RGB(63,255,51)的颜色,以此类推。然后将此对象传递给renderPng函数,即可得到想要的瓦片图像。
当然ColorMap类中还定义了一个子类Options,用于定义ColorMap的一些选项。
case class Options(
classBoundaryType: ClassBoundaryType = LessThanOrEqualTo,
/** Rgba value for NODATA */
noDataColor: Int = 0x00000000,
/** Rgba value for data that doesn’t fit the map */
fallbackColor: Int = 0x00000000,
/** Set to true to throw exception on unmappable variables */
strict: Boolean = false
)
classBoundaryType表示瓦片值与颜色值的对应方向,如刚刚的[-∞, 3.5]表示小于等于3.5,此处可以定义成GreaterThan, GreaterThanOrEqualTo, LessThan, LessThanOrEqualTo, Exact,意思非常清楚,不在这里赘述。
noDataColor表示瓦片的值为noData的时候显示的颜色。
fallbackColor表示不在映射范围内的值显示的颜色。
strict表示如果瓦片数据值不在定义之内,是报错还是使用fallbackColor进行渲染。
当然定义上述对应关系未免显得繁琐,Geotrellis为我们定义了一个ColorRamp类,实现了简单的自定义颜色对应关系的方法。
val colorRamp =
ColorRamp(0xFF0000FF, 0x0000FFFF)
.stops(100)
.setAlphaGradient(0xFF, 0xAA)
表示定义一个从0xFF0000FF到0x0000FFFF有100个渐变点的颜色对应,并且A值也从0xFF变至0xAA。
当然Geotrellis还为我们定义了一个ColorRamps类,里面封装了部分常用的颜色变化值,具体可以查看其源码。
final def BlueToOrange =
ColorRamp(
0x2586ABFF, 0x4EA3C8FF, 0x7FB8D4FF, 0xADD8EAFF,
0xC8E1E7FF, 0xEDECEAFF, 0xF0E7BBFF, 0xF5CF7DFF,
0xF9B737FF, 0xE68F2DFF, 0xD76B27FF
)
final def …
根据瓦片自动生成ColorMap
如果为瓦片直接定义ColorMap可以得到渲染的瓦片,但是存在颜色值固定无法动态调整以及非专业人员不能得到很好的颜色对应关系的问题。Geotrellis在ColorMap中定义了一个方法可以根据瓦片自动生成ColorMap,方法如下:
val colorMap = ColorMap.fromQuantileBreaks(tile.histogram, ColorRamp(0xFF0000FF, 0x0000FFFF).stops(10))
实现了将瓦片的值均匀对应到[0xFF0000FF, 0x0000FFFF]并分成10个等级,其中tile.histogram表示瓦片的值分布,从这我们不难看出,其完成的是根据瓦片的值统计分布,动态生成了一个ColorMap实例。
三、总结
以上讲述了如何渲染瓦片,具体效果大家可以自行实验,不在这里展示。虽然实现方法有易有难,但是也都代表了不同的需求,大家可以根据自己的需求选择合适的方法进行渲染。
本次实验再次证实了源码的重要性,还是要细致扎实的研读Geotrellis源代码方能更好的使用Geotrellis得到自己想要的结果。
geotrellis使用(十)缓冲区分析以及多种类型要素栅格化
目录
- 前言
- 缓冲区分析
- 多种类型要素栅格化
- 总结
- 参考链接
一、前言
上两篇文章介绍了如何使用Geotrellis进行矢量数据栅格化以及栅格渲染,本文主要介绍栅格化过程中常用到的缓冲区分析以及同一范围内的多种类型要素栅格化。
本文主要记录今天过程中碰到的两个问题,第一个问题就是线状要素在进行栅格化的时候只有单个像素,看不出应有的效果;第二个问题就是同一地区的数据既包含面状要素,又包含了线状要素,普通方式只能栅格化成两套数据。下面我为大家介绍解决这两个问题的方法(当然若有人有更好的方法,欢迎交流)。
二、缓冲区分析
缓冲区分析在百度百科中的定义为:
缓冲区分析是指以点、线、面实体为基础,自动建立其周围一定宽度范围内的缓冲区多边形图层,然后建立该图层与目标图层的叠加,进行分析而得到所需结果。它是用来解决邻近度问题的空间分析工具之一。邻近度描述了地理空间中两个地物距离相近的程度。
当然本文并不是教大家如何解决邻近度问题,只是简单的说明如何能够在栅格化的过程中将线状要素能够多外扩几个像素。
自己实现外扩像素
由于本人非地理信息专业出身(甚至非计算机专业出身,没办法,置身码农把青春卖!)所以在遇到问题的时候并不懂什么缓冲区分析的高大上的词汇。首先想到的是我可以在矢量化的过程中外扩几个像素,这样不就实现了增强的效果,但是有个问题就是我如何知道线段的方向,先将就着来,我把线段点上下左右的像素全部赋予与改点相同的值,这样可以不用考虑方向,并且应该能达到效果。
说干就干,再一次认真研读Geotrellis的Reasterizer.scala的源代码,冥思苦想一阵之后,想到了方法,主要是要重写赋值的方法,实现代码如下:
def rasterize(geom: Geometry, rasterExtent: RasterExtent, value: Int) ={
val cols = rasterExtent.cols
val array = Array.ofDim[Int](rasterExtent.cols * rasterExtent.rows).fill(NODATA)
val f = (col: Int, row: Int) => {
array(row * cols + col) = value
if (col > 0)
array(row * cols + col – 1) = value
if (col < cols – 1)
array(row * cols + col + 1) = value
if (row > 0)
array((row – 1) * cols + col) = value
if (row < rasterExtent.rows – 1)
array((row + 1) * cols + col) = value
}
Rasterizer.foreachCellByGeometry(geom, rasterExtent)(f)
ArrayTile(array, rasterExtent.cols, rasterExtent.rows)
}
简单说来就是之前f函数中只有array(row * cols + col) = value一条语句,即实现当前点的像素点赋值,那么加上了判断不是边界之后,给上下左右的像素点都赋值即可实现,运行起来。
得到的结果虽然看起来有点丑,但是总算解决了这个问题,然后把结果拿给老板看,老板什么话也没说,默默的甩给我https://gitter.im/geotrellis/geotrellis/archives/2016/02/22这么一个网址。好吧,老板果然是老板,这里也要介绍一下https://gitter.im/geotrellis/geotrellis/,这是Github中的Geotrellis项目交流群,在里面咨询问题,会有懂的人甚至作者解答,有点考验英语基础。
使用buffer函数
在那个网页中,上来就有这么一段代码:
val points = Seq(
Point(re.gridToMap(100,100)).buffer(30),
Point(re.gridToMap(200,200)).buffer(30),
Point(re.gridToMap(300,300)).buffer(30),
Point(re.gridToMap(400,400)).buffer(30),
Point(re.gridToMap(500,500)).buffer(30)
)
根据这段代码尤其是buffer名称,可以知道其实在Geotrellis中缓冲区分析就是使对象调用buffer函数即可,参数表示缓冲的距离。赶紧拿来试验,非常成功,但是这里面却有几个需要注意的问题。
- 缓冲距离
此处的缓冲距离经过实际测试发现与当前数据的坐标系相一致,即如果是WGS84地理坐标系,那么此处缓冲距离就是以经纬度为单位,大地坐标系此处就是以米为单位。
- 缓冲类型
一般情况下只需要给点、线要素使用缓冲即可,这里就可以使用模式匹配,如下:
val geom = WKT.read(pro.getValue.toString) match {
case geom: Point => geom.buffer(bufferDistance)
case geom: Line => geom.buffer(bufferDistance)
case geom: MultiLine => geom.buffer(bufferDistance).toGeometry().get
case geom => geom
}
这里就仅为Point、Line以及MultiLine类型进行了缓冲区设置,其他需要转换的可以用同样的方式进行匹配,展示一下最终的效果。
其实查看buffer函数的定义,不难发现该函数实现的就是将要点线要素转换成了面要素。
以上就实现了缓冲区分析,下面进行下一个主题多种类型要素栅格化。
三、多种类型要素栅格化
同一个区域数据即包含面状要素又包含线状要素,显然在shape文件中以及数据库中我们都没有办法将其进行合并,而如果我们又不想得到两套栅格化的数据该如何是好呢?
其实方法也很简单,只需要将要素拼接到同一个GeometryCollection中然后统一获取其RasterExtent即可,实现代码如下:
val features = mutable.ListBuffer[Geometry]()
for (path <- paths) {
val file = new File(path)
if(file.exists()) {
val shpDataStore = new ShapefileDataStore(new File(path).toURI().toURL())
shpDataStore.setCharset(Charset.forName(charset))
val featureSource = shpDataStore.getFeatureSource()
val itertor = featureSource.getFeatures().features()
while (itertor.hasNext()) {
val feature = itertor.next()
val p = feature.getProperties()
val it = p.iterator()
while (it.hasNext()) {
val pro = it.next()
if (pro.getName.getLocalPart.equals(“the_geom”)) {//get all geom from shp
val geom = WKT.read(pro.getValue.toString) match {
case geom: Point => geom.buffer(resolution * bufferDistance)
case geom: Line => geom.buffer(resolution * bufferDistance)
case geom: MultiLine => geom.buffer(resolution * bufferDistance).toGeometry().get //0.0054932 * 7
case geom => geom
}
features += geom
}
}
}
itertor.close()
shpDataStore.dispose()
} else
println(s”the file ${path} isn’t exist”)
}
以上代码实现的是逐个循环需要栅格化的文件,然后将每个geometry对象添加到features中,剩下的在前面的文章中已经介绍过,不再赘述。
四、总结
以上讲述了如何进行缓冲区分析以及多种类型要素栅格化。虽然实现方法比较较难,但是在刚碰到这些问题的时候确实会让人摸不着头脑,本文简单记录之,仅为整理思路以及方便以后使用,如果能够帮助到一些苦苦探索的人当然是更好的。最后感谢在工作过程中给予了重大帮助和指导的吴老板!
geotrellis使用(十一)实现空间数据库栅格化以及根据属性字段进行赋值
Geotrellis系列文章链接地址http://www.cnblogs.com/shoufengwei/p/5619419.html
目录
- 前言
- 安装空间数据库
- 空间数据库栅格化
- 根据属性字段进行赋值
- 总结
一、前言
前面写了一篇文章(geotrellis使用(八)矢量数据栅格化)讲解了如何使用Geotrellis将Shape文件栅格化,并许下了后续会写一篇文章讲解空间数据库栅格化的诺言,周末虽然不是闲来无事,但是也得抽出时间兑现自己的诺言,就认认真真的折腾了一番,总算完成了,遂记录之。
二、安装空间数据库
目前有许多数据库添加了空间支持,如SQLSERVER、Postgre、Sqlite等,本文选择开源的Postgre,其空间支持名称为PostGis。
网上讲解Postgre安装的文章很多,在这里主要强调两点。
- 在安装完Postgre之后,要点击Application Stack Builder选择Spatial Extensions安装空间扩展。
- 在创建数据库的时候需要选择空间模板,否则数据库不支持空间操作。
三、空间数据库栅格化
3.1 添加Postgre驱动
由于项目采用sbt框架,所以只需要在build.sbt文件中添加一句libraryDependencies += “org.postgresql” % “postgresql” % “9.4.1208”即可,此处给大家提供一个网站可以查询常用jar包的sbt添加方式,链接为http://search.maven.org。
3.2 连接Postgre
此处只用到最基本的读取数据库,代码如下:
var url = “jdbc:postgresql://localhost:5432/dbName”
var conn: Connection = null
try {
conn = DriverManager.getConnection(url, “user”, “pass”)
val statemnt = conn.createStatement(ResultSet.TYPE_FORWARD_ONLY, ResultSet.CONCUR_READ_ONLY)
val rs = statemnt.executeQuery(“select * from tablename”)
while (rs.next()) {
rs.getString(“columnName”)
}
}
catch {
case e: Throwable => println(e.getMessage)
}
conn.close
其中dbName表示空间数据库名称,user表示用户名,pass表示密码,tablename表示表名,columnName表示要取的字段名。
3.3 读取空间数据
此处需要先准备空间数据,具体不在这里赘述,简单的方式可以将shape file直接导入到数据库中。然后查看空间字段名称,一般为geom。
其实读取空间数据与读取普同数据相同,只需要更改一下select语句,给需要读取的空间字段添加一个st_astext函数即可,如select st_astext(geom) as geom from tablename,这样采用rs.getString(“geom”)读出来的就是一个WKT字符串,后续处理与之前介绍的Shape file栅格化相同。
四、根据属性字段进行赋值
在geotrellis使用(八)矢量数据栅格化一文中介绍的栅格化方式只能给栅格化后的空间对象赋同一个值,无论是Shape file还是空间数据库,有时候往往需要读取另一个属性(字段),并将此属性的值作为空间对象栅格化后的值。其实现方式与之前的方式基本相同,主要存在两点不同:
- 需要多读取一个属性值
- 每个空间属性根据此值赋值
4.1 读取字段值
读取与空间字段相同,需要注意的是要与空间字段的值一一对应,可以采用Map或者自定义类(包含Geometry对象和值对象)的方式进行关联。
4.2 为空间属性赋值
之前介绍的栅格化方式是使用Rasterizer.rasterizeWithValue(features, re, value)直接为所有空间对象赋同一个值value,此处需要为每个对象赋不同的值,可以采用以下方式:
val tile = ByteArrayTile.fill(byteNODATA, re.cols, re.rows)
for (feature <- features) {
Rasterizer.foreachCellByGeometry(feature.geometry, re) { (col, row) => tile.set(col, row, Math.round(feature.value).toInt) }
}
此处的feature是自己定义的一个类,具体为case class VectorData(geometry: Geometry, value: Double)。
具体实现原理是:先新建一个Tile类型对象,然后循环每个空间对象,调用Rasterizer类中的foreachCellByGeometry方法,其定义如下:def foreachCellByGeometry(geom: Geometry, re: RasterExtent)(f: (Int, Int) => Unit)。这里采用柯里化函数的方式,f表示为空间对象赋值的函数,这里为其赋值为(col, row) => tile.set(col, row, Math.round(feature.value).toInt),即为tile的(col, row)坐标点赋值为对应的属性值。
五、总结
以上就是利用周末时间完成的读取空间数据库栅格化以及为空间对象赋对应的其他字段的值的实现方法,都很基础。但是万丈高楼原地起,只有经过一点点的积累,一点点的努力方能成就你的伟岸高楼。周末愉快!
geotrellis使用(十二)再记录一次惨痛的伪BUG调试经历(数据导入以及读取瓦片)
Geotrellis系列文章链接地址http://www.cnblogs.com/shoufengwei/p/5619419.html
目录
- 前言
- BUG还原
- 查找BUG
- 解决方案
- 总结
- 后记
一、前言
最近做一项实验,简单的说就是读取已经存入Accumulo中的瓦片,然后对瓦片进行简单的Map操作然后RenderPng生成瓦片,前台显示。看上去是个很简单的操作,但是中间一直存在一个问题,就是明明数据值范围在[0-10] (除了某些地方无值),但是处理完后某些地方会出现数值严重偏差的情况,在100以上(处理逻辑也不应该出现这么大的值),具体效果就是瓦片中某些地方是空白的(因为用了ColorMap,超过10的没有定义,所以是空白的),百思不得其解,辗转反侧,最后终于顿悟,遂记录之。
二、BUG还原
首先准备一个8位有符号类型的tiff,然后使用ingest导入Accumulo,然后读取tile并进行简单的逻辑处理,然后渲染发送到前台显示,这时候你就可以看到很多诡异的事情。
三、查找BUG
此BUG查找过程颇为闹心,前前后后折腾了好几天,猜测并实验了各种原因,最后才发现真正的问题。
3.1 怀疑处理逻辑
因为我的处理为11-value,因为原始范围是[0, 10],所以此处相当于将数值反了个个,这个地方会有什么问题呢,怎么结果会大于100多呢,通过各种调试生成tiff等,发现原始数据有-100多的,所以此处就变成了正的100多,那么就先判断value是否小于0,大于0的才处理,成功解决问题,显示OK。但是真的解决问题了吗?(当然没解决,解决了就不会有这篇文章了,哈哈)为什么会出现值为负的情况呢,我原始数据范围可是[0, 10]啊?
3.2 怀疑Byte类型
然后以为是Byte类型造成的,在Scala中,Byte的范围是[-128, 127],而在C#等有些语言中,Byte的范围是[0, 255]。在Geotrellis中ByteArrayTile对应基础数据类型为Byte,UByteArrayTile对应基础数据类型为UByte,二者同时对应tiff中的Byte类型,ByteArrayTile类型生成的tiff多了一项PIXELTYPE=SIGNEDBYTE。所以刚开始一直以为是数据类型的问题,想当然的认为tiff文件所支持的Byte类型的范围也是[0, 255],其实这时候根本没有发现问题的本质,并且也没有对tiff进行认真研究,认为使用UByteArrayTile就能解决问题,但是考虑到万一将来数据有负值的情况怎么办呢?所以又苦思冥想半天没有结果,折腾了半天BUG也没有解决。
3.3 真相浮出水面
将从Accumulo读出来的数据直接生成tiff,会发现一个很诡异的问题,NODATA这一项居然没有了,我原来可是正儿八经写的-128,在又咨询了圈内人士之后大概明白了为什么会出BUG。
因为在瓦片切割的过程中会进行重采样,这样肯定是读的数据不包含NODATA值,所以在进行重采样的时候有些点自然就变成了负值,因为0到10之间的数与-128作用自然就是负的(比如内插法的线性)。
但是问题又来了,为什么切瓦片之前读TIFF的时候没有读入TIFF的NODATA呢,之前为了解决切瓦片采样方式的问题,重写了ETL类,但是大部分地方都一样,只有在投影和建立金字塔的时候添加了其他采样方法,所以刚好可以在这里进行打印调试,一试果然与猜测一致,输出cellType,全是int8raw,表示读入的是没有NODATA值的Byte类型,怎么会这样,明明原始数据是有NODATA值的,这时候看到输入参数,可以指定cellType,于是数据导入的时候加了一项参数–cellType int8,测试,发现问题解决,导入的时候打印信息全部正常。
幸福来的太突然,让人不知所措,难道问题就这么解决了(了解国产电视剧的观众都知道:没有,哈哈)。这时候再看从Accumulo中读出来的Tile,发现数据类型居然变成了int8ud0,这是什么鬼,查了一下源码发现是byte类型的用户自定义NODATA,并且NODATA值为0的这么一种类型。
为什么会出现这么一种类型,只能再看读取瓦片的源代码,主要代码如下:
def read(key: K): V = {
val scanner = instance.connector.createScanner(header.tileTable, new Authorizations())
scanner.setRange(new ARange(rowId(keyIndex.toIndex(key))))
scanner.fetchColumnFamily(columnFamily(layerId))
val tiles = scanner.iterator
.map { entry =>
AvroEncoder.fromBinary(writerSchema, entry.getValue.get)(codec)
}
.flatMap { pairs: Vector[(K, V)] =>
pairs.filter(pair => pair._1 == key)
}
.toVector
if (tiles.isEmpty) {
throw new TileNotFoundError(key, layerId)
} else if (tiles.size > 1) {
throw new LayerIOError(s”Multiple tiles found for $key for layer $layerId”)
} else {
tiles.head._2
}
}
其实上述代码最关键的就是AvroEncoder.fromBinary(writerSchema, entry.getValue.get)(codec),意思就是将二进制数据读成Tile,没看出有什么问题,好吧,请教原作者,只告诉我采用新版本可以,于是我更新新版本Geotrellis,发现这块读取确实好了,但是悲剧的是前面的采样造成的负值的问题又出来了。
又折腾了数次,问题还是没有解决,想到刚开始在数据导入的时候为了实现Tiff边界拼接的问题,路径输入的是文件夹,这样相当于同时导入一个文件夹下的所有Tiff,现在是不是这个地方变了呢。一试果然如此,导入单个Tiff,采样没有问题,同时导入一个文件夹则会出问题。那么这显然又是Geotrellis的一个BUG。
四、解决方案
解决方案就三点:
- 导入数据的时候添加–cellType int8即添加指定的类型,可以解决导入的时候无数据值的问题,并能够解决瓦片切割重采样时候造成的无效值。至于为何需要添加此配置项,为什么Geotrellis不能自动读出Tiff的NODATA值还需下一步进一步研究。
- 针对不能再导入文件夹下所有Tiff的问题,有又三种解决方案。第一,如果不需要考虑重采样负值带来的影响可以继续使用文件夹作为输入;第二,可以事先将Tiff拼接起来,当然Tiff不能太大;第三,不考虑Tiff边界处缝隙带来的影响。貌似三种都不是最好的解决方案,下一步要继续研究数据导入这块的源代码,看看有没有办法从根本上解决。
- 从Accumulo读取瓦片cellType的问题在升级到0.10.1后自动解决。
五、总结
本次BUG调试,历经数天,折腾无数次,总结出以下几点:
- 对采样、切瓦片等基础地理信息知识掌握的不够全面。
- 研读源码不够细致。
- 不要完全相信Geotrellis,其也是有不完善以及BUG的————尽信书则不如无书。
- 发现问题远比解决问题重要。
- 做事情要执着。
六、后记
恰逢今日高中群里原先语文老师孩子参加高考,咨询志愿情况,有人建议先选城市、有人建议先选学校、有人建议学计算机、有人建议学会计。。。众说纷纭,各种出世入世。
我说我建议学哲学,其实我觉得其他任何专业都只是工具,只有思想上去了,你干任何事情都能做好。当然有人要说,很多人没学哲学思想也很有深度,做事也很成功。其实还是那句话,一个人一辈子做好一件事情足以,将一件事情能做到至善至美,那么你的思想自然而然的也就上去了,这时候你再去做任何事情,岂有不成的道理。但是一般人深受花花世界的吸引,不能耐得住这份寂寞去做一件事,唯有哲学,能教你从方法论等角度去思考世界、探索世界,自然你的思想也就慢慢得到升华。
对待写程序同样如此,只有拥有一颗执着的心,遇到问题能够刨根问底,你的思想自然也就上去了,对待任何问题你都将如履平地。如果只是一味的为写程序而写程序,那么你终究是一个代码的搬运工。
思想高于一切!
geotrellis使用(十三)数据导入BUG解决方案说明
Geotrellis系列文章链接地址http://www.cnblogs.com/shoufengwei/p/5619419.html
目录
- 前言
- BUG说明
- 解决方案
- 总结
一、前言
在上一篇文章中介绍了一个自己写程序过程中的BUG,并提出质疑是否是Geotrellis的BUG,又经过几天的折腾之后,最终可以明确证明这个BUG肯定是Geotrellis造成的,现记录之。
二、BUG说明
当我们将一个Byte有符号类型的Getiff数据使用Geotrellis(版本0.10.1)自带的Etl类导入Accumulo中的时候,如果参数中的path(输入路径)为文件夹,其中包含多个geotiff文件的话,导入的过程会丢掉NODATA值,并且即使强制指定cellType为int8,切片的过程重采样-128也会参与运算,而其他Geotiff类型不存在该问题。
三、解决方案
所以上一篇中有关数据导入的解决方案就变成了以下两点:
- 如果需导入的Geotiff为单个文件,不存在该问题,所以可以考虑将多个文件合成单个文件。
- 有时候单个文件太大或者不规则等,可以考虑将数据类型转换成Short类型等。
四、总结
此BUG有了上述解决方案,但是并没有完全搞清楚造成此BUG的原因,这几天分析调试了无数次,没有发现问题,初步考虑是在Geotiff生成rdd的过程中数据出现了问题,最近几天比较忙,后续会继续分析此BUG。
另如果有人精通地理信息方面的English,也麻烦将此BUG翻译成英文,好向原作者请教,本人英文水平貌似翻译这个问题有点难度。
geotrellis使用(十四)导出定制的GeoTiff
Geotrellis系列文章链接地址http://www.cnblogs.com/shoufengwei/p/5619419.html
目录
- 前言
- 需求说明
- 实现方案
- 总结
一、前言
最近一段时间比较忙,没能继续推进Geotrellis项目开发,周末和这两天抽空又实现了一个功能——导出自定义的Tiff文件。又恰巧碰上今天这么重要的日子,当然要写点东西来纪念一下,所以就有了这篇文章,闲话莫说,进入正题。
二、需求说明
很多时候我们需要从一块(或者很多块)大的Tiff中根据需要截取一部分数据,并且需要采用某种采样方式转成特定的投影,并转成需要的数据类型。当然有人会说这个很容易,用GDAL的gdaltransform等可以很容易的实现此功能,GDAL是很强大,但是前提是你的数据不能太大并且只能处理单块栅格数据。正因为有这些问题,所以我实现了使用Geotrellis来实现该功能,下面我就为大家分析实现方法。
之前讲了很多数据处理方式,其中。
三、实现方案
1.前台界面
前台就是一个简单的地图控件,外加几个选择器。地图控件主要为了浏览区域以及手工选取想要导出的Tiff的范围,选择器主要选择目标投影方式、数据类型以及采样方式。根据用户的选择将请求采用ajax的方式发送到后台进行处理。这块不是本文的重点,不在这里具体介绍。
2.数据导入
要想处理大数据或者处理多块栅格数据就不能直接处理栅格数据,可以先将栅格数据导入到Accumulo中,当然导入之后是一块块的瓦片,这部分在geotrellis使用(三)geotrellis数据处理过程分析一文中已经进行了详细介绍,这里还是要说明的是参数layoutScheme一定要选择floating,这样在Accumulo中保存的就是原始只是切割而未经过其他处理的数据。
3.读取数据
Accumulo中已经存储了需要的数据,并且后台接收到了前台用户选择的区域范围以及投影方式、数据类型、采样方式,这样我们就可以开始实现读取需要的数据,简单的说就是从Accumulo中取出与用户选定区域有交集的数据(瓦片),实现代码如下:
val raster = reader.read[SpatialKey, Tile, TileLayerMetadata[SpatialKey]](layerId)
val masked = raster.mask(polygon)
是不是很容易,就这两句话,其中reader是AccumuloLayerReader实例,layerId表示读取的层,polygon是用户选取的范围。首先从Accumulo中读出该层数据,然后与polygon做一个mask,得到的结果就是用户想要导出的数据。
4.数据转换
4.1 得到结果瓦片数据
首先将上述得到的瓦片集做一个拼接,这样就会得到一个大的瓦片,代码也很简单,如下:
val stitch = masked.stitch
val tile = stitch.tile
4.2 得到最终结果
之后要做的就是根据采样类型、投影方式以及数据类型将上述tile进行转换,代码如下:
val rep = tile.reproject(extent, srcCRS, dstCRS, method).tile
val res = rep.convert(cellType)
其中extent是瓦片的范围,可以用上述拼接对象stitch的stitch.extent得到,srcCRS是原始数据的投影类型,可以通过上述raster对象的raster.metadata.crs得到,dstCRS表示目标投影方式,即用户想要的投影方式,同样method表示采样方法,cellType表示数据类型,这三个的获取方式我会重点介绍。
4.3 获取dstCRS、resampleMethod、cellType
首先可以肯定的是前端传来的这三个参数都是字符串型的,这就要求后台将字符串转成相应的类型。
投影方式我这里投了个懒,传递的是EPSG CODE,EPSG是投影方式的一种数字编码,具体请见:http://www.epsg.org/。总之每一个EPSG编码对应了一种投影方式,像常见的经纬度投影的编码是4326,WebMercator的编码是3857。有了这个编码之后就可以很容易的得到投影方式,代码如下:
try{
CRS.fromEpsgCode(epsg)
}
catch {
case _ => CRS.fromEpsgCode(3857)
}
采样方式和数据类型就稍显麻烦,我这里采用了反射的方式获取对应实例,我将反射的代码进行了封装,代码如下L:
def getClassName(name: String, hasEndWith$: Boolean) = {
var className = name
if (hasEndWith$) {
if (!className.endsWith(“$”))
className += “$”
}
else {
if (className.endsWith(“$”))
className = className.substring(0, className.length – 1)
}
className
}
def getClassFor[T: ClassTag](name: String, hasEndWith$: Boolean) = {
val className = getClassName(name, hasEndWith$)
Try[Class[_ <: T]]({
val c = Class.forName(className, false, getClass.getClassLoader).asInstanceOf[Class[_ <: T]]
val t = implicitly[ClassTag[T]].runtimeClass
if (t.isAssignableFrom(c)) c else throw new ClassCastException(t + ” is not assignable from ” + c)
})
}
def getInstanceByReflact[T: ClassTag](name: String) = {
val classTry = getClassFor[T](name, true) recoverWith { case _ => getClassFor[T](name, false) }
classTry flatMap{
c =>
Try{
val module = c.getDeclaredField(“MODULE$”) //通过获得变量”MODULE$”来初始化
module.setAccessible(true)
val t = implicitly[ClassTag[T]].runtimeClass
module.get(null) match {
case null => throw new NullPointerException
case x if !t.isInstance(x) => throw new ClassCastException(name + ” is not a subtype of ” + t)
case x: T => x
}
} recover{ case i: InvocationTargetException if i.getTargetException ne null => throw i.getTargetException }
}
这段代码看上去很复杂,其实是做了很多判断加强程序稳定性用的的,主要功能就是一个类的全名(包含包名)创建其实例。
有了上述代码之后就可以将前台传来的字符串直接转换为相应的实例,获取采样方式的代码如下:
val resample = s”geotrellis.raster.resample.${resampleStr}”
val method = getInstanceByReflact[ResampleMethod](resample)
if(method.isSuccess) {
println(method.get.toString)
method.get
}
else {
Bilinear
}
前台只需传入采样方式名称即可,如Bilinear,这样就会自动获取其实例。
获取数据类型同理,代码如下:
val className = getCellTypeClassName(dataTypeStr)
val cellType = getInstanceByReflact[CellType](className)
if(cellType.isSuccess) {
cellType.get
}
else {
ByteConstantNoDataCellType
}
这样就可实现获取用户想要的投影方式、采样方法以及数据类型。
四、总结
以上就是使用Geotrellis实现导出定制的GeoTiff的方法,由于时间紧,可能还有很多没有注意的细节,会在后续中进一步研究,并更新该文或者另设新篇。在这里我也呼吁大家都来撰写技术博客,一来提高自己,进行技术总结;二来真的是可以帮助别人。最近在工作中碰到很多莫名其妙的BUG,但是基本都在一番搜索之后在别人的博客中找到了解决方案,所以在此也感谢那些愿意写博客的人,希望大家都能加入进来。
geotrellis使用(十五)使用Bokeh进行栅格数据可视化统计
Geotrellis系列文章链接地址http://www.cnblogs.com/shoufengwei/p/5619419.html
目录
- 前言
- 实现方案
- 总结
一、前言
之前有篇文章介绍了使用Bokeh-scala进行数据可视化(见http://www.cnblogs.com/shoufengwei/p/5722360.html),其实当时选择Bokeh的部分原因就是Bokeh支持大数据量的可视化,有点“大数据”的意思,总之这刚好能与Geotrellis结合起来进行一些地理信息方面的大数据可视化统计工作。
比如我们可以实现统计一大块区域内的DEM高程分布情况,将每个高程值出现多少次进行简单的可视化,最终效果如下图所示。下面为大家分析实现方法。
二、实现方案
简单来说就是使用Geotrellis读取前端传入的区域内的数据,然后根据高程值进行分类,最后使用Bokeh进行可视化。下面逐一说明。
1.读取数据
首先要将数据导入到Accumulo中,layoutScheme选择floating,这一块介绍过多次了,不再赘述。
从Accumulo中读取数据在上一篇文章中也已经做了介绍,大同小异,在这里要简单一点,实现代码如下:
val layerId = LayerId(layerName, 0)
val raster = reader.read[SpatialKey, Tile, TileLayerMetadata[SpatialKey]](layerId)
val polygon = maskz.parseGeoJson[Polygon].reproject(LatLng, raster.metadata.crs)
val masked = raster.mask(polygon)
val tile = masked.stitch.tile
通过以上语句就能将用户输入区域的数据拼接成一个大瓦片。
2.根据高程分类
得到瓦片之后要进行高程分类,首先定义一个可变的map对象,然后从最小值到最大值都映射为0添加到map中,最后循环每一个瓦片值更新map对象,代码如下:
var map = scala.collection.mutable.Map[Double, Double]()
val (min, max) = tile.findMinMax
for (i <- min to max)
if (!map.contains(i))
map += i.toDouble -> 0.0
tile.histogram.foreach { (key, value) => {
map(key.toDouble) = map(key.toDouble) + value
}
}
3.使用bokeh进行可视化
之后要做的就是根据采样类型、投影方式以及数据类型将上述tile进行转换,代码如下:
object source extends ColumnDataSource {
val x = column(map.keys.toIndexedSeq)
val y = column(map.values.toIndexedSeq)
}
val xdr = new DataRange1d()
val ydr = new DataRange1d()
import source._
val plot = BokehHelper.getPlot(xdr, ydr, Pan | WheelZoom | Crosshair)
BokehHelper.plotBasic(plot)
BokehHelper.setCircleGlyph(plot, x, y, source)
plot.title(“栅格数据分析”)
BokehHelper.save2Document(plot)
其中source类中map就是上述求出的高程值与出现次数对应的映射。BokehHelper类就是在使用Bokeh-scala进行数据可视化一文中我封装的帮助类,具体可以参考该文。这样就完成了对区域内高程进行分类、统计、可视化。
三、总结
看似对高程进行统计分析、可视化没有太大的意义,这里介绍的其实只是一种思路、方法,我们可以对任意的栅格数据进行上述操作,如土壤、水域、资源环境等等,所以思想高于一切。
geotrellis使用(十六)使用缓冲区分析的方式解决投影变换中边缘数据值计算的问题
Geotrellis系列文章链接地址http://www.cnblogs.com/shoufengwei/p/5619419.html
目录
- 前言
- 问题探索
- 采样说明
- 实现方案
- 总结
一、前言
上一篇文章讲了通过Geotrellis导出自定义的Tiff文件(见geotrellis使用(十四)导出定制的GeoTiff),但是实际中有时会有BUG,就是数据值发生非常明显的变化,理论上只进行了切割、重投影操作,数据值不应该会发生特别大的变化。今天认认真真查找了下问题,发现是因为采样方式造成的。
二、问题探索
使用QGIS打开导出的Tiff文件,形状、位置、投影等信息都正确,甚至大部分数据值都正确,唯一出现问题的地方就是边缘,边缘出现了很多不正常的值。经过试验不同的投影方式、采样方式、数据类型,发现只有在投影方式选择4326(原始数据投影方式是墨卡托-3857),采样方式选择三次卷积法内插等几种重采样方式的时候才会出现边缘的问题,那么很明显导致该问题的原因肯定是投影的时候选择的采样方式造成的,发现问题是解决问题的第一步。
三、采样说明
什么是采样?先来看一下百度百科对重采样的定义。
就是根据一类象元的信息内插出另一类象元信息的过程。在遥感中,重采样是从高分辨率遥感影像中提取出低分辨率影像的过程。
简单的说采样就是根据栅格图中坐标点周围的一些值重新计算该点的值。这里我们虽然没有进行降低分辨率操作但是由于改变了投影方式,各坐标点的数据肯定是要重新计算的,所以需要用到重采样。那么为什么采样会造成边缘数据值出现偏差呢?
很简单,重采样要根据坐标点周围的几个点的值来重新计算当前点的值,在图像边缘处,只有部分临近点有数据,其他无数据的地方会用NODATA值来替代,所以计算结果当然会出问题。
下面简单介绍一下在Geotrellis中支持的采样方式以及其几种常用的采样方式的简单原理。在Geotrellis中写好了以下几种采样方式:
| 编号 |
英文名称 |
中文名称 |
| 1 |
NearestNeighbor |
最邻近内插法 |
| 2 |
Bilinear |
双线性内插法 |
| 3 |
CubicConvolution |
三次卷积法内插 |
| 4 |
CubicSpline |
三次样条插值 |
| 5 |
Lanczos |
正交相似变换 |
| 6 |
… |
… |
最近邻插值法是最简单的插值方法。也称作零阶插值,就是令变换后像素值等于距它最近的输入像素值。所以采用该方法边缘值计算不会出现问题。
双线性内插法取(x,y)点周围的4邻点,在y方向(或x方向)内插两次,再在x方向(或y方向)内插一次,得到(x,y)点的值f(x,y)。
设4个邻点分别为(i,j),(i,j+1),(i+1,j),(i+1,j+1),i代表左上角为原点的行数,j代表列数。设α=x-i,β=y-j,过(x,y)作直线与x轴平行,与4邻点组成的边相交于点(i,y)和点(i+1,y)。先在y方向内插,计算交点的值f(i,y)和f(i+1,y)。f(i,y)即由f(i,j+1)与f(i,j)内插计算而来。简单的说就是选周围的四个点,然后做一条水平的线,按照线性求出水平线与四个点组成的四边形的交点的值,然后根据这两个值再计算出该点的值,理论上使用Bilinear也应该会出现边缘问题,但是实际测试并没有出现。查看其源码,发现其实现原理是根据四个点进行一个加权计算,所以边缘处有值,只是不够准确。
三次卷积法内插法计算精度高,但计算量大,它考虑坐标点周围的16个邻点值,具体公式不在这里罗列,可以参考(http://wenku.baidu.com/link?url=mvyjK0h98UAldYFr_L0-qW-3Rj73uW_yMz0Jwo4ulbWUIfzdAI9f_qOqv_rVqhlTDmEU3xW6vLxp8JTTDtTeCsBGmcb1pmkUfhv-XlkAB6O)。
三次样条插值是通过一系列形值点的一条光滑曲线,数学上通过求解三弯矩方程组得出曲线函数组的过程。简单说就是找插值结果是光滑的。其他采样方式不在哲理具体介绍。
理论上插值结果越精确则需要的邻点就越多,边缘处就越容易出问题。可能Geotrellis中采样代码写的并不完善是导致边缘问题的因素之一,也许随着Geotrellis的更新,边缘问题会自动解决。但是目前来看我们必须要想一个办法来解决这个问题,下面就是本文重点要讲的——使用缓冲区分析的方式解决投影变换中边缘数据值计算的问题。
四、实现方案
1.缓冲区分析
之前在做矢量数据栅格化的时候已经讲解过一次(见geotrellis使用(十)缓冲区分析以及多种类型要素栅格化)。这里用到缓冲区分析的思想,首先将要导出的区域做一个缓冲区分析,将范围扩大,然后根据扩大后的区域进行切割、重投影、数据类型转换等工作,待处理完毕之后再根据原始区域进行切割,这样虽然投影变换时的边缘问题依然存在,但是有问题的边界比实际需要的边界大,在用原始数据切割的时候,“有问题的边界”自然就被去掉了,就能得到一个正确的结果。下面来看具体实现。
2.扩大区域
这一步很简单,Geotrellis中已经写好了缓冲区分析的函数,直接调用即可,代码如下:
poly.buffer(3 * cellWidth)
其中ploy是原始区域,cellWidth是栅格数据的分辨率,这里相当于将面扩大3个像素,保证有足够的邻点。有了扩大后的区域之后,按照上文讲述的方式处理数据即可。
3.裁剪结果
将得到的处理结果按照原始区域进行切割即可得到最终结果,但是Geotrellis中并没有提供不规则切割的方式,只能按照矩形切割。所以我们只能按照不规则区域的外接矩形进行切割,而原始区域又不一定是矩形,即使按照外接矩形切割一样会在很多地方包含扩大后的边界,得不到理想的效果。为了解决这一问题可以先将处理结果按照原始区域进行mask操作,然后切割,便会得到正确的结果。实现代码如下:
val mask = tile.mask(extent, poly)
val realTile = GeoTiff(mask, extent, crs)
.raster
.crop(poly.envelope)
其中poly为原始区域,extent为缓冲区分析后的面的外接矩形,crs为数据投影方式,poly.envelope获取原始区域的外接矩形。这样第一行实现了mask操作,第二行先将mask的结果转为Geotiff然后进行crop(切割)操作。
五、总结
以上就是通过使用缓冲区分析的方式解决投影变换中边缘数据值计算过程中出现偏差的问题。看似简单的原理与实现过程,其实同样可以上升到哲学的高度去思考。当我们解决一个问题的时候,如果不能有所突破何不换个角度考虑绕过这个问题,采取迂回的方式。当然该方法不止能解决重采样造成的问题,凡是涉及到边缘值计算的都可以采用该方法,下一篇文章我将讲解如何使用该方法解决瓦片计算过程中的边缘问题。最后申明这么好的方法并不是我想出来的,要归功于吴老板(具体姓名不在这里透露(●’◡’●))。
geotrellis使用(十七)使用缓冲区分析的方式解决单瓦片计算边缘值问题
Geotrellis系列文章链接地址http://www.cnblogs.com/shoufengwei/p/5619419.html
目录
- 前言
- 需求分析
- 实现方案
- 总结
一、前言
最近真的是日理千机,但是再忙也要抽出时间进行总结。上一篇文章讲了使用缓冲区分析的方式解决投影变换中边缘数据值计算的问题(见geotrellis使用(十六)使用缓冲区分析的方式解决投影变换中边缘数据值计算的问题)。实际中往往还有一种需求就是对单个瓦片进行操作,比如求坡度等,如果这时候直接计算,同样会出现边缘值计算的问题,这种情况也可以使用上一篇文章中讲到的方法进行处理。
二、需求分析
假如我们想在前台地图中实时显示坡度图像,有两种方式:第一种是在DEM数据导入Accumulo之前先求坡度(可以使用传统的GDAl、也可以使用Geotrellis),然后再导入;第二种是直接将DEM数据导入Accumulo中,后台实时计算每幅瓦片的坡度,然后渲染到前台。两种方式各有各的好处,采用第一种方式,整体处理简单,显示的速度快,但是Accumulo中要存两份数据。第二种方式,实现起来稍显复杂,显示的速度稍慢,但是Accumulo中只存了一份数据。由于Geotrellis基于Spark集群,所以如果集群足够优秀,处理速度不是很重要的问题,但是如果我们需要对同一个数据进行多种操作,或者根据用户的需求来进行操作,那么就没有办法完成数据的预处理工作,只能进行实时计算,如果计算只针对瓦片中的单一像素则还不涉及到边缘值的问题,而如果需要进行插值采样等操作(如求坡度、山影等),这时候就会出现上文中讲到的瓦片边缘值计算的问题。本文就为大家讲解如何使用缓冲区分析的方式解决单瓦片计算边缘值问题。
三、实现方案
至于求坡度等的具体算法不在这里介绍,都是很成熟的算法,并且Geotrellis中也已经实现了一些算法,只需调用相应的函数即可。有关缓冲区分析等也在之前的文章介绍过多次,不在这里赘述。
1.数据读取
此处读的数据为没有进行过任何处理的原始DEM数据,具体读写数据也在之前的文章中介绍过,详情见geotrellis使用(三)geotrellis数据处理过程分析等文章。
但是此处不同的是我们为了完成边缘值计算,就需要将单幅瓦片周围的八幅瓦片同时读入,即需要读9幅瓦片,这个我们只需要根据当前瓦片的key值算出周围瓦片key值,然后逐一读取即可。获取9幅瓦片key值的代码如下:
val keys =
for (i <- -1 to 1; j <- -1 to 1)
yield {
val col = key.col + i
val row = key.row + j
SpatialKey(col, row)
}
逐一读取瓦片代码如下:
val tiles =
keys.map { k =>
tileReader.reader[SpatialKey, Tile](layerId).read(k)
}
其中tileReader为AccumuloValueReader实例,layerId包含当前数据存放layer以及层级zoom。
将9幅瓦片拼接成1幅瓦片代码如下:
val pairs = keys zip tiles
val pieces = pairs.map { case (key, tile) => tile ->((key.col – mincol) * 256, (key.row – minrow) * 256) }
implicitly[Stitcher[Tile]].stitch(pieces, 256 * 3, 256 * 3)
其中mincol为keys中的col最小值,minrow为keys中的row最小值,循环遍历keys即可求出。这样就实现了将9幅瓦片拼成1幅,完成数据读取工作。
2.瓦片处理
上一步得到了拼接好的“大瓦片”,这里在Geotrellis中与之前的“小瓦片”一样的都是Tile实例,采用与之前数据处理相同的处理方式即可,唯一需要注意的是瓦片不在是256*256,而变成了原来的3倍。处理完之后原来边缘值计算有问题的地方,这样就被巧妙的避开了。
3.裁剪结果
数据处理完之后下一步要做的就是将瓦片重新裁剪成256*256。实现代码如下:
val startcol = tile.cols / 2 – 256 / 2
val startrow = tile.rows / 2 – 256 / 2
val endcol = tile.cols / 2 + 256 / 2 – 1
val endrow = tile.rows / 2 + 256 / 2 – 1
tile.crop(startcol, startrow, endcol, endrow)
因为要从“大瓦片”的中间取出256*256像素,所以需要按照上面的公式求出开始以及结束的像素偏移。这样就得到了边缘值没有问题的瓦片。
四、总结
以上就是通过使用缓冲区分析的方式解决单瓦片计算边缘值问题。有些地方还可以优化,比如取的时候不要取9幅瓦片,只取比当前瓦片稍微向外扩展几个像素值等,具体由读者自行思考。
geotrellis使用(十八)导入多波段Tiff、读取多波段Tile
Geotrellis系列文章链接地址http://www.cnblogs.com/shoufengwei/p/5619419.html
目录
- 前言
- 多波段数据导入
- 读取多波段瓦片
- 提取单波段
- 总结
一、前言
之前我们处理的都是单波段的Tiff数据,可以实现瓦片的读取、处理等操作,如果Tiff为多波段Tiff,并且我们不希望在导入的时候将多波段合并成单波段,这时候就需要进行多波段数据处理。多波段数据处理方式基本与单波段处理方式相同,稍有差别,我在这里简单介绍之。
二、多波段数据导入
首先准备一个多波段的Tiff文件,将其导入Accumulo中。单波段数据导入代码如下:
implicit val sc = SparkUtils.createSparkContext(“ETL SinglebandIngest”, new SparkConf(true))
Etl.ingest[ProjectedExtent, SpatialKey, Tile](args, ZCurveKeyIndexMethod)
sc.stop()
多波段基本相同,代码如下:
implicit val sc = SparkUtils.createSparkContext(“ETL MultibandIngest”, new SparkConf(true))
Etl.ingest[ProjectedExtent, SpatialKey, MultibandTile](args, ZCurveKeyIndexMethod)
sc.stop()
运行方式为将代码达成jar包,然后提交到spark集群,这在之前文章中已经介绍过,不同的是format参数要设置为multiband-geotiff。
三、读取多波段瓦片
多波段数据存入Accumulo中之后,读取单个瓦片的代码如下:
val multiTile = tileReader.reader[SpatialKey, MultibandTile](LayerId(name, zoom)).read(key)
其中name表示多波段瓦片存储的layer,zoom为读取瓦片的层级,key为瓦片的x、y坐标,tileReader为AccumuloValueReader实例。这样得到的结果就是一个MultibandTile对象。
四、提取单波段
读取出多波段瓦片之后可以进行各种各样的操作,比如将多波段取出三个波段进行RGB渲染之后在前台显示,或者通过前台控制显示任意单一波段的瓦片数据。在这里我简单介绍一些显示单一波段瓦片。
理论上很简单,因为MultibandTile对象,简单来说就是一个Tile的数组,这时候只需要获取到用户想要浏览的波段值,从数组中提取出相应的Tile即可。代码如下:
multiTile.bands(bandNum)
其中bandNum为想要提取的波段号。
五、总结
本文简单介绍了多波段数据导入、处理的一些细节,真的是很简单,因为目前关于多波段只进行了这些工作,遂将其简单总结之,还未深入涉及,研究的宽度和深度都不够,下一步会根据工作情况深入研究之后进行进一步总结。
geotrellis使用(十九)spray-json框架介绍
Geotrellis系列文章链接地址http://www.cnblogs.com/shoufengwei/p/5619419.html
目录
- 前言
- spray-json简介
- spray-json使用
- 总结
一、前言
Json作为目前最流行的数据交换格式,具有众多优势,在Scala语言中以及当我们使用Geotrellis前后台交换数据的时候都少不了要使用Json,本文为大家介绍一款开源的Json处理框架——spray-json。
二、spray-json简介
spray-json是一款使用Scala语言编写的开源Json处理框架。GitHub地址:https://github.com/spray/spray-json。其中对其介绍如下:
spray-json is a lightweight, clean and efficient JSON implementation in Scala.
It sports the following features:
A simple immutable model of the JSON language elements
An efficient JSON parser
Choice of either compact or pretty JSON-to-string printing
Type-class based (de)serialization of custom objects (no reflection, no intrusion)
No external dependencies
spray-json allows you to convert between
String JSON documents
JSON Abstract Syntax Trees (ASTs) with base type JsValue
instances of arbitrary Scala types
大意就是spray-json轻量、无依赖、高效,没有使用反射等。可以在JSON字符串对象、AST(JSON树)对象、Scala类型之间任意转换。
在Scala程序中使用spray-json,只需要在build.sbt文件中添加libraryDependencies += “io.spray” %% “spray-json” % “1.3.2”,然后更新sbt即可。
三、spray-json使用
总体上使用spray-json需要先定义一个转换的协议(Protocol),该协议指定了如何在Scala对象与JOSN对象之间进行转换。spary-json也提供了一些基础类型的转换协议,在DefaultJsonProtocol类中。
3.1 基础类型转换
首先引入spray-json以及DefaultJsonProtocol
import spray.json._
import DefaultJsonProtocol._
然后可以直接进行类型转换,代码如下:
val str = “””{“name”:”wsf”, “age”:26}”””
val json: JsValue = str.toJson
val json2 = str.parseJson
println(json2.prettyPrint)
println(json2.compactPrint)
val age = 26
val json_age = age.toJson
json_age.convertTo[Int]
使用toJson和parseJson都能将字符串或其他类型转换成JsValue,prettyPrint是将json以分行的方式优雅的输出,compactPrint直接在一行压缩输出,convertTo可以直接将json对象转为Scala对应的类型。
DefaultJsonProtocol支持的数据类型列表如下:
- Byte, Short, Int, Long, Float, Double, Char, Unit, Boolean
- String, Symbol
- BigInt, BigDecimal
- Option, Either, Tuple1 – Tuple7
- List, Array
- {Map, Iterable, Seq, IndexedSeq, LinearSeq, Set, Vector}
- {Iterable, Seq, IndexedSeq, LinearSeq, Set}
- JsValue
3.2 case class类型转换
如果不在DefaultJsonProtocol支持的数据类型中就需要我们自己定义JsonProtocol,最简单的类型是case class,其方法如下:
case class MyInt(value: Int)
object MyIntProtocol extends DefaultJsonProtocol {
implicit val format = jsonFormat1(MyInt)
}
import MyIntProtocol._
val json2 = MyInt(10).toJson
println(json2)
val myInt = json2.convertTo[MyInt]
println(myInt)
简单的说就是定义一个object类,并添加一个隐式参数,参数的值为jsonFormatX(X表示数字)函数将自定义的case类传入。
这里需要说明的是自定义的case类有几个属性这里X就为几,即调用相应的函数。如果case类还定义了伴随的object类,那么jsonFormatX函数就需要传入MyInt.apply。并且MyIntProtocol类的定义不能放在调用位置的后面,否则会出错。
3.3 包含泛型的类型转换
如果case类的属性中包含了泛型那么实现方法稍有不同,代码如下:
case class MyList[A](name: String, items: List[A])
object MyListProtocol extends DefaultJsonProtocol {
implicit def myListFormat[A: JsonFormat] = jsonFormat2(MyList.apply[A])
}
import MyListProtocol._
val json3 = MyList[Int](“wsf”, List(1, 2, 3)).toJson
println(json3.prettyPrint)
val myList = json3.convertTo[MyList[Int]]
println(myList)
同样是定义一个object类,并添加一个隐式函数,不同的是传入的是MyList.apply[A],即apply加泛型,并且需要指明返回类型为[A: JsonFormat]。此处还需要说明的是在基本的case类中定义隐式变量的时候用的是implicit val,而此处用的是implicit def,个人理解是在scala中变量与函数的定义比较模糊,二者基本是等价的,但是此处返回值的类型是泛型,所以要用def。
3.4 普通class类的转换
如果是一个普通的class类,就需要自己定义write和read方法。代码如下:
class Person(val name: String, val age: Int)
object MyPersonProtecol extends DefaultJsonProtocol {
implicit object myPersonFormat extends RootJsonFormat[Person] {
override def write(person: Person): JsValue = JsArray(JsString(person.name), JsNumber(person.age))
override def read(json: JsValue): Person = json match {
case JsArray(Vector(JsString(name), JsNumber(age))) => new Person(name, age.toInt)
case _ => deserializationError(“Person expected”)
}
}
}
import MyPersonProtecol._
val person = new Person(“wsf”, 26)
val json = person.toJson
println(json.prettyPrint)
val per = json.convertTo[Person]
此处相当于隐式format不在由jsonFormatX函数返回,而是自定义一个类并继承自RootJsonFormat。上述代码将Person实例转换成JsArray,既json数组对象,Person的各个属性按照定义的顺序存放到数组,同时也可以将json数组对象转换为Person实例。如果我们需要的是一个标准的json树对象而不仅仅是json数组,可以按照下述方式定义隐式对象。
implicit object myPersonFormat2 extends RootJsonFormat[Person] {
override def write(person: Person): JsValue = JsObject(
“name” -> JsString(person.name),
“age” -> JsNumber(person.age)
)
override def read(json: JsValue): Person = json.asJsObject.getFields(“name”, “age”) match {
case Seq(JsString(name), JsNumber(age)) => new Person(name, age.toInt)
case _ => deserializationError(“Person expected”)
}
}
上述代码将Person对象转换成如下形式的json树对象,当然也可实现反向转换。
{
“name”: “wsf”,
“age”: 26
}
3.5 递归类型转换
如果是case类属性又包含自身,既递归类型,在定义隐式对象的时候稍有不同,需要显式指明对象的属性,并将jsonFormat的结果传给lazyFormat,我想这里主要是为了防止递归过程中出现无限循环等错误。代码如下:
case class Foo(i: Int, foo: Option[Foo])
object myRecursiveProtocol extends DefaultJsonProtocol {
implicit val format: JsonFormat[Foo] = lazyFormat(jsonFormat(Foo, “i”, “foo”))
}
import myRecursiveProtocol._
val foo: Foo = Foo(1, Some(Foo(2, Some(Foo(3, None)))))
val json = foo.toJson
println(json)
最终得到的结果如下:
{“i”:1,”foo”:{“i”:2,”foo”:{“i”:3}}}
3.5 直接操作JSON对象
有时候可能我们并不需要这么复杂的功能,就想简单的拼接成JSON对象,这时候可以直接创建JsArray或者JsObject对象,按照自己的要求拼接即可。代码如下:
val json = JsArray(JsNumber(1), JsNumber(2), JsNumber(3), JsString(“wsf”))
println(json)
val json2 = JsObject(
“name” -> JsString(“wsf”),
“age” -> JsNumber(26)
)
println(json2)
结果如下:
[1,2,3,”wsf”]
{“name”:”wsf”,”age”:26}
四、总结
本文简单介绍了spray-json框架在处理json对象时候的一些常规操作和细节,希望能对理解json以及处理json有所帮助,并为Geotrellis中前后台数据交换等打好基础。
geotrellis使用(二十)geotrellis1.0版本新功能及变化介绍
目录
- 前言
- 变化情况介绍
- 总结
一、前言
之前版本是0.9或者0.10.1、0.10.2,最近发现更新成为1.0.0-2077839。1.0应该也能称之为正式版了吧。发现其中有很多变化,在这里为大家简单介绍。
二、变化情况介绍
2.1 数据导入变化
之前数据导入参数基本都要写在命令行,刚查看之前写的博客发现没有介绍数据导入的,只有一个老版的调用本地数据的,本文就在这里简单介绍Geotrellis的数据导入。
Geotrellis可以将数据(Tiff)从本地、HDFS、S3中导入到本地、HDFS、Accumulo、HBASE、CASSANDRA、S3等,可选方式很多,而且是通过Spark集群并行处理,其实相当于Geotrellis已经实现了分布式的瓦片切割。老版的命令如下:
spark-submit –class geotrellis.Ingest –driver-memory=2G jarpath
–input hadoop –format geotiff –cache NONE -I path=filepath
–output accumulo -O instance=accumuloinstance table=tablename user=username
password=password zookeeper=zookeeper –layer layername –crs EPSG:3857 –layoutScheme floating
其中geotrellis.Ingest是一个调用Geotrellis内部数据导入的类,就是调用了ETL类进行数据自动上传。代码如下:
implicit val sc = SparkUtils.createSparkContext(“Ingest”, new SparkConf(true))
Etl.ingest[ProjectedExtent, SpatialKey, Tile](args, ZCurveKeyIndexMethod)
sc.stop()
如果是多波段数据将Tile换成MultibandTile即可。接着说上面的脚本,input表示数据输入方式,如果是本地和HDFS就写hadoop,如果是S3就写s3。format是数据类型,单波段tiff为geotiff,多波段tiff为multiband-geotiff。path为数据存放路径。output指定输出存放位置。后面是该位置的一些配置。具体非常复杂,可以参考https://github.com/pomadchin/geotrellis/blob/master/docs/spark-etl/spark-etl-intro.md。
上面的数据导入配置看上去是不是很乱,并且完全没有组织,1.0版进行了很大的改进,将配置信息基本都写在了json文件里。1.0版数据导入命令如下:
spark-submit \
–class geotrellis.dataimport.DataIngest –driver-memory=2G $JAR \
–input “file:///input.json” \
–output “file://output.json” \
–backend-profiles “file://backend-profiles.json”
看上去是不是很清爽,将配置信息写在了三个文件里,下面逐一介绍这三个文件。
input表示输入信息的配置,其json文件如下:
[
{
“name”: “landsat”,
“format”: “geotiff”,
“backend”: {
“type”: “hadoop”,
“path”: “file:///datapath/”
},
“cache”: “NONE”
}
]
这是一个json数组可以写多个。name相当于旧版的layername,format不变,type相当于旧版的input,path不变。
output表示输出信息的配置,其json文件如下:
{
“backend”: {
“type”: “accumulo”,
“path”: “through”,
“profile”: “accumulo-201”
},
“reprojectMethod”: “buffered”,
“cellSize”: {
“width”: 256.0,
“height”: 256.0
},
“tileSize”: 256,
“pyramid”: true,
“resampleMethod”: “nearest-neighbor”,
“keyIndexMethod”: {
“type”: “zorder”
},
“layoutScheme”: “zoomed”,
“cellType”:”int8″,
“crs”: “EPSG:3857”
}
大部分意思与旧版相同,主要是backend中的信息,type相当于旧版的output,path相当于table,profile表示accumulo或其他输出方式的配置,具体写在backend-profiles.json文件中。
backend-profiles中存放数据库等配置信息,其json文件如下:
{
“backend-profiles”: [
{
“name”: “accumulo-201”,
“type”: “accumulo”,
“zookeepers”: “zookeeper”,
“instance”: “accumulo-instance”,
“user”: “username”,
“password”: “password”
},
{
“name”: “cassandra-local”,
“type”: “cassandra”,
“allowRemoteDCsForLocalConsistencyLevel”: false,
“localDc”: “datacenter1”,
“usedHostsPerRemoteDc”: 0,
“hosts”: “localhost”,
“replicationStrategy”: “SimpleStrategy”,
“replicationFactor”: 1,
“user”: “”,
“password”: “”
}
]
}
backend-profiles节点下可以存放多个数据库配置信息,其中name就是output.json文件中的backend.profile。
2.2 性能提升
1.0版本明显做了很多优化,代码也变的更整洁清晰,带来的结果是性能明显提升。比如数据导入之前导入数据比较费时,且经常失败,1.0版更加稳定,并且速度明显提升。数据读取以及处理的速度也有所提升,我的系统中原来需要90ms处理的数据,现在可能只需要60ms左右,原来需要600ms处理的现在也只需要300ms左右。其实下面要讲的更是一个性能方面的提升。
2.3 LayerReader读取整层数据的变化
比如我们希望能够实现用户选择任意区域数据(以SRTM为例)并能够自动拼接、下载该区域的SRTM数据,首先我们需要将全球的SRTM数据导入Geotrellis中,然后当有用户请求的时候读出SRTM的数据,进行拼接等操作。旧版的时候我们就需要将整层数据读出,然后根据用户输入的范围调用mask方法进行掩码操作。而新版大大改进了这一点,我们可以直接取出用户输入范围内的数据。下面我为大家介绍使用LayerReader读取整层数据的三种实现方式。
也有可能是旧版就有直接取出用户输入范围内的数据的方法我没有发现,在这里不做深究,将三种方式都简单介绍,仅供参考。
第一种方式直接读取整层数据。代码如下:
reader.read[SpatialKey, Tile, TileLayerMetadata[SpatialKey]](layerId)
其中reader是FilteringLayerReader[LayerId]对象,下同,从名字就能看出应该是1.0版新加的带有过滤的层读取类(旧版为AccumuloLayerReader类),layerId为读取的层的信息,下同。适用该方式就会将该layerId的整层数据读出。
第二种方式为read方法添加一个LayerQuery对象。实现代码如下:
reader.read[SpatialKey, Tile, TileLayerMetadata[SpatialKey]](layerId, new LayerQuery[SpatialKey, TileLayerMetadata[SpatialKey]].where(Intersects(polygon)))
其实就是用where语句加了一个过滤条件,Intersects(polygon)表示条件是与polygon相交,polygon是用户选择的范围,并且需要跟原始数据采用同一投影,此处有个小bug,就是仅支持MultiPolygon,如果是Polygon对象需要使用MultiPolygon(polygon)进行简单封装,下同。这样就能实现只读取该层中的与polygon相交的数据。
第三种方式就是第二种方式的语法糖,写起来更加简单方法。代码如下:
reader.query[SpatialKey, Tile, TileLayerMetadata[SpatialKey]](layerId).where(Intersects(polygon)).result
以上就是实现整层数据读取的三种方式,如果需要处理的上述业务需求,最好采用后两种方式,进行实际测试,效率提高10倍左右。但是后两种方式有个小bug:如果polygon与层中的数据相交的瓦片(源数据在Accumulo等数据库中存放的方式是256*256的瓦片)是较小的区域,可能该瓦片不会被取出,即会被过滤掉,Geotrellis毕竟是一个新的框架,我们应该包容其中的BUG,寻找合适的方式绕过BUG实现我们的需求。
三、总结
本文简单介绍了1.0版Geotrellis中的变化,不难看出Geotrellis正在快速的向前推进,我相信假以时日,一定会变的更加完善、更加好用,我对Geotrellis的未来充满信心。
geotrellis使用(二十一)自动导入数据
目录
- 前言
- 整体介绍
- 前台界面
- 后台控制
- 总结
一、前言
之前Geotrellis数据导入集群采用的是命令行的方式,即通过命令行提交spark任务来ingest数据,待数据导入完毕再启动主程序进行数据的调用。这样造成的一个问题就是数据导入与数据处理不能无缝对接,并且只能由管理员导入数据导入数据流程也很麻烦,用户想要导入自己的数据几乎不可能。本文为大家介绍一种自动数据导入方式——通过浏览器前端界面实现交互式数据导入。
二、整体介绍
通过浏览器方式导入,摆脱了SHELL的限制并且可交互式,大大方便了普通用户的操作;并且也能将数据的导入与数据管理、用户控制、权限控制等结合起来,可以说是优点非常多,也是一个很重要的环节;同时相当于直接实现了数据导入、处理、展示的流程化作业,将数据服务一体化,等同于在分布式集群中实现了Arcgis等传统软件的发布数据服务。
本文主要从前台和后台两个方面来介绍数据的自动导入,前台主要实现了数据位置的选择,单波段多波段数据的选择等,后台接收到用户的请求后将选择的数据导入到相应的位置,导入完毕后即可在前台进行显示。
三、前台界面
前台界面比较简单,由于不是美工出身,所以比较简陋,主要看功能。整体界面如下。
主要就是一个地址输入框,目前还是手工输入,后续可以与hdfs的管理结合起来,实现从hdfs中选择数据;一个是否多波段得选择框,如果数据为多波段需要勾选此框,这样后台会将数据直接切成MultibandTile否则会将波段合并切割成只有一个波段的Tile;一个导入按钮,无需多言。浏览器将文件位置以及是否多波段通过ajax的方式发送到后台,后台接收到之后进行导入处理。
四、后台控制
上一篇文章中简单介绍了1.0版Geotrellis在导入数据的时候配置信息发生了变化,主要信息基本都写在了json文件中(见geotrellis使用(二十)geotrellis1.0版本新功能及变化介绍),这也为我们实现自动导入提供了便利,只需要将json文件做成模板,读出模板字符串将相应信息替换成用户输入值,然后将信息提交到spark完成作业即可。
4.1 生成导入数据的EtlConf
EtlConf是Geotrellis中导入数据的配置类,要实现导入数据,首先就要创建EtlConf的实例,然后将此实例交给Etl类即可完成数据导入。所以我们首先要实现根据用户输入创建EtlConf实例。由于原始的EtlConf类直接根据在SHELL中提交作业时配置的input.json、output.json与backend-profiles.json文件中读取信息完成自身的实例化,所以我们需要创建一个自己的EtlConf类根据前台传入的数据封装配置信息,并生成一个EtlConf实例。我们可以直接拼接json数据进行传入,我在这里偷了个懒,将上述三json文件做成了模板,自定义的EtlConf类先读取模板然后根据前台传入数据修改模板配置信息,但是由于output.json与backend-profiles.json文件内容基本不需要变化,所以不用做成模板,直接读取即可,当然如果你有需要更改的配置也可以进行同样操作,input.json模板文件如下所示:
[
{
“name”: “{name}”,
“format”: “{format}”,
“backend”: {
“type”: “hadoop”,
“path”: “{path}”
},
“cache”: “NONE”
}
]
由于没有考虑从S3读取数据,所以backend.type项并未配置成模板,同样如果需要自行更改即可。其中{name}可以表示数据导入存放的层,当然此处可以根据用户信息或时间等信息进行配置,只要能够与当前用户相关联即可;{format}表示输入文件信息,如果是单波段文件此处为geotiff,如果为多波段文件此处为multiband-geotiff;{path}表示文件位置,根据前台数据修改即可。配置好这些信息之后即可创建EtlConf实例,方法与原始EtlConf类相同,这里不做介绍,将自定义的EtlConf类整体代码放在下面,仅供参考。
import com.github.fge.jackson.JsonLoader
import geotrellis.helper.ConfigHelper
import geotrellis.spark.etl.config.{BackendProfile, EtlConf, Input, Output}
import geotrellis.spark.etl.config.json._
import org.apache.spark.SparkContext
import spray.json.DefaultJsonProtocol._
import spray.json._
/**
* Created by wsf on 2016/9/8.
*/
object UserEtlConf {
def updateInputJson(path: String, isMulti: Boolean, m: Map[Symbol, String]) = {
val input = m(‘input)
val inputPath = s”file://${path}”
val format = if(isMulti) “multiband-geotiff” else “geotiff”
val name = “userlayer”
val realInput = input.replace(“{path}”, inputPath).replace(“{format}”, format).replace(“{name}”, name)
m.updated(‘input, realInput)
}
//todo: update some output information
def updateOutputJson(m: Map[Symbol, String]) = {
m
}
//todo: update some backend-profiles information
def updateBackendProfilesJson(m: Map[Symbol, String]) = {
m
}
def getSet(path: String, isMulti: Boolean)(implicit sc: SparkContext) = {
val confPath = ConfigHelper.confPath
val args = Array(“–input”, s”file://${confPath}inputTemplete.json”, “–output”, s”file://${confPath}output.json”, “–backend-profiles”, s”file://${confPath}backend-profiles.json”)
val m: Map[Symbol, String] = EtlConf.parse(args)
val inputM = updateInputJson(path, isMulti, m)
val outputM = updateOutputJson(inputM)
updateBackendProfilesJson(outputM)
}
def apply(path: String, isMulti: Boolean)(implicit sc: SparkContext): List[EtlConf] = {
val m = getSet(path, isMulti)
val (backendProfiles, input, output) = (m(‘backendProfiles), m(‘input), m(‘output))
val inputValidation = EtlConf.inputSchema.validate(JsonLoader.fromString(input), true)
val backendProfilesValidation = EtlConf.backendProfilesSchema.validate(JsonLoader.fromString(backendProfiles), true)
val outputValidation = EtlConf.outputSchema.validate(JsonLoader.fromString(output), true)
if (!inputValidation.isSuccess || !backendProfilesValidation.isSuccess || !outputValidation.isSuccess) {
if (!inputValidation.isSuccess) {
println(“input validation error:”)
println(inputValidation)
}
if (!backendProfilesValidation.isSuccess) {
println(“backendProfiles validation error:”)
println(backendProfilesValidation)
}
if (!outputValidation.isSuccess) {
println(“output validation error:”)
println(outputValidation)
}
sys.exit(1)
}
val backendProfilesParsed = backendProfiles.parseJson.convertTo[Map[String, BackendProfile]]
val inputsParsed = InputsFormat(backendProfilesParsed).read(input.parseJson)
val outputParsed = OutputFormat(backendProfilesParsed).read(output.parseJson)
inputsParsed.map { inputParsed =>
new EtlConf(
input = inputParsed,
output = outputParsed,
inputProfile = inputParsed.backend.profile,
outputProfile = outputParsed.backend.profile
)
}
}
}
4.2 完成数据导入
有了EtlConf实例,只需要将其传入Etl类即可完成数据导入,此处要注意的是需要根据是否多波段传入不同的类型,具体代码如下所示:
def ingest(path: String, isMulti: Boolean)(implicit sc: SparkContext): Unit = {
if (!isMulti)
ingestTile[ProjectedExtent, SpatialKey, Tile](path, isMulti)
else
ingestTile[ProjectedExtent, SpatialKey, MultibandTile](path, isMulti)
}
def ingestTile[
I: Component[?, ProjectedExtent] : TypeTag : ? => TilerKeyMethods[I, K],
K: SpatialComponent : TypeTag : AvroRecordCodec : Boundable : JsonFormat,
V <: CellGrid : TypeTag : Stitcher : (? => TileReprojectMethods[V]) : (? => CropMethods[V]) : (? => TileMergeMethods[V]) : (? => TilePrototypeMethods[V]) : AvroRecordCodec
](
path: String, isMulti: Boolean, modules: Seq[TypedModule] = Etl.defaultModules
)(implicit sc: SparkContext) = {
implicit def classTagK = ClassTag(typeTag[K].mirror.runtimeClass(typeTag[K].tpe)).asInstanceOf[ClassTag[K]]
implicit def classTagV = ClassTag(typeTag[V].mirror.runtimeClass(typeTag[V].tpe)).asInstanceOf[ClassTag[V]]
val etlConfs = UserEtlConf(path, isMulti)
etlConfs foreach { conf =>
val etl = Etl(conf, Etl.defaultModules)
val sourceTiles = etl.load[I, V]
val (zoom: Int, tiled) = etl.tile[I, V, K](sourceTiles)
etl.save[K, V](LayerId(etl.input.name, zoom), tiled)
}
}
主要就是在ingest函数中调用ingestTile函数的时候根据是否多波段为泛型赋不同的类型,单波段为Tile,多波段为MultibandTile。ingestTile中的代码与原始Etl类中的代码基本相同,首先使用自定义的UserEtlConf类创建EtlConf实例,然后提交到Etl完成数据导入,自此便完成了交互式数据导入。
4.3 前台浏览导入结果
如果前台能够在后台导入完毕后既浏览到自己的数据,这在用户体验以及查看数据完整性等方面都有很好的作用。实现的方式有很多,如通过WebSocket在后台导入完毕后通知前台刷新页面,或者前台定时循环请求后台等。无论采用什么方式只需要能够将导入的数据以TMS的方式发送到前台即可实现该功能,这样就打通了数据发布的整个流程。
五、总结
本文为大家简单介绍了如何实现交互式的数据导入。洋洋洒洒关于Geotrellis的使用已经写了二十多篇,总体来说经历了一个从“无知”到稍微“有知”的这么一个过程。回首走过的这段Geotrellis岁月,从中无论是编程技术还是思维方式还是遥感影像处理以及地理信息系统甚至文字功底等多方面知识都有了明显的提高,自我感觉博客中总结的技术点以及博客行文也都相较越来越好,这条路我会一直走下去。
geotrellis使用(二十二)实时获取点状目标对应的栅格数据值
目录
- 前言
- 实现方法
- 总结
一、前言
其实这个功能之前已经实现,今天将其采用1.0版的方式进行了重构与完善,现将该内容进行总结。
其实这个功能很常见,比如google地球上当我们鼠标移动的时候能够自动获取到鼠标所在位置的高程信息就是本文所讲的一种效果。本文我们也以DEM数据为例,但是读者应当清楚任何栅格数据都可以采用此种方式获取点状目标栅格数据值。如果我们采用传统的方式很难能够对全球的SRTM数据实时获取某个点的值,采用Geotrellis分布式的方式可以很好的解决这一问题。最近实在太忙,闲话少说,直接进入干货。
二、实现方法
2.1 前台界面
前台只需要采用leaftlet框架,然后添加一个mousemove事件,获取鼠标当前位置经纬度值,并将其转成GeoJson然后通过ajax的方式发送到后台,后台将结果通过json等方式传到前台,前台在需要的位置将结果show处来即可。
2.2 数据准备
要想能够获取到栅格数据的值,首先要有相应的数据,比如SRTM数据,将SRTM数据通过之前文章中讲解的数据导入部分介绍的方式导入到Accumulo中(参考geotrellis使用(二十)geotrellis1.0版本新功能及变化介绍),注意由于我们并不需要显示SRTM瓦片,所以不需要生成金字塔,此处导入的时候layoutScheme参数设置为floating即可。
2.3 获取坐标点栅格数据值
后台接收到前台传入的point值之后,首先转化成Point对象,并完成重投影(前台一般为WGS84投影,而栅格数据一般为WebMercator等,当然如果你的前后投影方式一致,则不需要重投影)。实现代码如下:
def parseGeoJson2Geometry(geomStr: String, srcCrs: CRS = LatLng, dstCrs: CRS = WebMercator) = {
import geotrellis.vector.io.json.Implicits._
import geotrellis.vector.reproject.Implicits._
geomStr
.parseGeoJson[Geometry]
.reproject(srcCrs, dstCrs)
}
这样就可以完成将GeoJson转成Point对象。有了这个对象我们就可以查询该点的值。接下来首先查询该点所在的瓦片。实现代码如下:
implicit def tmToMapKeyTransform(tm: TileLayerMetadata[SpatialKey]): MapKeyTransform = tm.mapTransform
val raster = reader.query[SpatialKey, Tile, TileLayerMetadata[SpatialKey]](layerId).where(Contains(point)).result
其中第一行加入一个隐式转换,否则会报错,将TileLayerMetadata[SpatialKey]对象转换成MapKeyTransform对象,GEotrellis中大量采用了隐式转换的方式,以及采用kind-projector实现泛型边界控制,这块确实还研究的不够深入,很多地方看的不是很懂,需要继续研究。第二行就是查找包含该点的瓦片。有了这个结果,就可以查找该点对应的数据值。实现代码如下:
val stitched = raster.stitch
val value = stitched.getValueAtPoint(point)
这样就获取到了该点的值,再返回到前台即可。
三、总结
本文为大家简单介绍了如何实时获取点状目标对应的栅格数据值,凡是跟点状目标有关的都可以通过此种方式实现。而且如果是线状目标,可以先转换成多个点状目标然后再逐一获取其值。当然你也可以先通过缓冲区分析,将点状目标或者线状目标变成面,然后采用geotrellis使用(十四)导出定制的GeoTiff一文中介绍的面状对象获取分析的方式来进行处理。
geotrellis使用(二十三)动态加载时间序列数据
目录
- 前言
- 实现方法
- 总结
一、前言
今天要介绍的绝对是华丽的干货。比如我们从互联网上下载到了一系列(每天或者月平均等)的MODIS数据,我们怎么能够对比同一区域不同时间的数据情况,采用传统的方法可能只能将所有要参考的数据用ArcGIS等打开,然后费劲的一一对比等,不仅操作繁琐,搞不好日期等还会对应错。本文就是介绍使用Geotrellis动态加载时间序列数据,使我们能够自由选择日期浏览或者像动画一样循环展示一系列数据。直接进入干货。
二、实现方法
2.1 前台界面
前台与以往保持不变,但是你需要保证能够提供请求时间的时间序列范围,如想实现根据用户输入的日期展示当期数据,那么你需要提供一个日期选择器;如果你想动态加载系列数据那么你必须能够提供这一系列的日期范围,并能够自动改变日期。总之你需要将日期作为一个参数发送到后台已达到请求该日期数据的效果。
2.2 数据准备
这一块与以往变化比较大,首先要对tiff数据进行预处理,重投影等自不需要多言,主要是要给tiff加个时间头信息。有两种方式,可以使用GDAL或者自己写程序,分布介绍如下:
1、使用GDAL实现添加时间头信息
只需要一条命令即可:
gdal_edit -mo TIFFTAG_DATETIME=”time” yourtiff.tif
上述命令就会给tiff文件添加一个名为TIFFTAG_DATETIME的头文件信息,time表示你想添加的时间,需要符合ISO标准,否则你需要在导入数据的时候指定时间格式。
2、使用Geotrellis实现添加时间头信息
主要步骤为读取tiff文件、修添加时间头信息、保存新的tiff文件。代码如下:
val tiff = SinglebandGeoTiff(path)
tiff.tags.headTags + (Tags.TIFFTAG_DATETIME -> time)
val newtiff = new SinglebandGeoTiff(tiff.tile, tiff.extent, tiff.crs, Tags(map, tiff.tags.bandTags), tiff.options)
newtiff.write(newTiffPath)
代码同样很简单,但是说实话不如GDAL来的方便,仅供参考。
2.3 时间序列数据导入
数据准备好之后我们就可以开始着手导入,这里面有很多需要改变的地方。
1、改变数据导入类
普通tiff数据导入的时候调用ETL类的方式如下:
Etl.ingest[ProjectedExtent, SpatialKey, Tile](args)
但是到了时间序列数据就要变为:
Etl.ingest[TemporalProjectedExtent, SpaceTimeKey, Tile](args)
主要是添加时间支持,ProjectedExtent变为TemporalProjectedExtent,SpatialKey变为SpaceTimeKey,当然如果是多波段还需要将Tile替换为MultibandTile。
2、改变导入参数
在geotrellis使用(二十)geotrellis1.0版本新功能及变化介绍一文中已经介绍过了1.0版Geotrellis导入数据的方式变为json文件,这里input.json中只需要将format由geotiff改为temporal-geotiff;output.json中需要将keyIndexMethod中的内容改成如下方式:
“keyIndexMethod”:{
“type”:”zorder”,
“temporalResolution”: 86400000,
“timeTag”:”TIFFTAG_DATETIME”,
“timeFormat”:”yyyy:MM:dd HH:mm:ss”
}
其中temporalResolution表示时间精度,理论上来说,设置此值表示当你根据时间查询的时候在这个精度范围内的数据都应该能够查询出来,但是实际上好像并不是这样,不知道是其bug还是我操作方式有问题,需要后续进一步研究;timeTag指定时间头字段名称;timeFormat指定时间格式。
完成以上步骤之后即可将时间序列数据导入到accumulo中。
2.4 获取对应时间数据瓦片
前台将请求的时间已经瓦片的x、y、z编号传入后台,后台接收到之后根据此四个参数进行查询,相较普通tiff数据实际上只是多添加了时间条件。请求瓦片代码如下:
val dt = DateTimeFormat.forPattern(“yyyy:MM:dd HH:mm:ss”).parseDateTime(time)
val key = SpaceTimeKey(x, y, dt)
val layerId = LayerId(name, zoom)
respondWithMediaType(MediaTypes.`image/png`) {
val result = {
val tile = tileReader.reader[SpaceTimeKey, Tile](layerId).read(key)
tile.renderPng.bytes
}
complete(result)
}
其中name表示上一步数据导入时存放的名字;tileReader为AccumuloValueReader实例。这样就能将用户请求的时间以及x、y、z瓦片数据渲染之后发送到前台,这里还需要强调的是Geotrellis中时间处理采用joda开源框架,关于其用法大家可以网上自行搜索。最后为大家附上两张截图,当然如果是动画效果会更好,由于没有录制,仅提供两张截图以达到展示动态的效果。
三、总结
本文为大家简单介绍了如何动态加载时间序列数据,同样读者可以根据自己的需求任意发挥想象,达到自己需要的效果。比如可以实现动态展示全球洋流、大气、农作物、植被等变化情况。凡是在一段时间内有变化的数据,当我们搜集到足够多的数据并添加时间标签之后即可将其“动”起来,我想这种展示效果一定很棒。
geotrellis使用(二十四)将Geotrellis移植到CDH中必须要填的若干个坑
目录
- 前言
- 若干坑
- 总结
一、前言
近期干了一件事情,将geotrellis程序移植到CDH中(关于CDH,可以参考安装ClouderaManager以及使用ClouderaManager安装分布式集群的若干细节),本以为这是件很简单的事情,没想到跟安装CDH一样却碰到了许多的坑,很多事情真的就是这样,我们不去亲自实践觉得都是简单的,当我们真正甩开膀子去干的时候却发现会遇到各种各样的问题,但是当我们将这些一个个解决的时候,你收获的将不仅是美好的结果,更是很多通过学习无法得到的东西,这应该就是古人所谓的纸上得来终觉浅。鸡汤不多喝,直接进入正题。
二、若干坑
2.1 spark-submit部署模式
CDH中的spark完全采用yarn的模式部署,即将任务调度等提交到yarn,完全由yarn来控制程序的运行。目前还没发现这方面有什么问题,主要就是如果之前采用local模式或者其他模式此处可能稍有不同,需要注意。
2.2 akka与spray
这是我碰到的第一个问题,当运行service主程序的时候立马会报如下错误:
java.lang.AbstractMethodError: com.sjzx.spray.can.HttpManager.akka$actor$ActorLogging$_setter_$log_$eq(Lakka/event/LoggingAdapter;)V
at akka.actor.ActorLogging$class.$init$(Actor.scala:335)
at com.sjzx.spray.can.HttpManager.<init>(HttpManager.scala:29)
at com.sjzx.spray.can.HttpExt$$anonfun$1.apply(Http.scala:153)
at com.sjzx.spray.can.HttpExt$$anonfun$1.apply(Http.scala:153)
at akka.actor.TypedCreatorFunctionConsumer.produce(Props.scala:401)
at akka.actor.Props.newActor(Props.scala:339)
at akka.actor.ActorCell.newActor(ActorCell.scala:534)
at akka.actor.ActorCell.create(ActorCell.scala:560)
at akka.actor.ActorCell.invokeAll$1(ActorCell.scala:425)
at akka.actor.ActorCell.systemInvoke(ActorCell.scala:447)
at akka.dispatch.Mailbox.processAllSystemMessages(Mailbox.scala:262)
at akka.dispatch.Mailbox.run(Mailbox.scala:218)
at akka.dispatch.ForkJoinExecutorConfigurator$AkkaForkJoinTask.exec(AbstractDispatcher.scala:386)
at scala.concurrent.forkjoin.ForkJoinTask.doExec(ForkJoinTask.java:260)
at scala.concurrent.forkjoin.ForkJoinPool$WorkQueue.runTask(ForkJoinPool.java:1339)
at scala.concurrent.forkjoin.ForkJoinPool.runWorker(ForkJoinPool.java:1979)
at scala.concurrent.forkjoin.ForkJoinWorkerThread.run(ForkJoinWorkerThread.java:107)
上来就让人蒙圈,毫无头绪,根本不知道什么问题,经过苦苦探索以及Google等,才明白过来是spray和akka的版本问题,然后试验了各种办法,最终通过降低版本的方式勉强解决了这个问题,有人说通过ShadeRule的方式也可以,但是我没能成功,如果有人通过这种方式成功解决这个问题,欢迎指教。降低版本后的sbt依赖如下:
“io.spray” % “spray-routing” % “1.2.3”,
“io.spray” % “spray-can” % “1.2.3”,
造成这个问题的原因应该是spray与cloudera运行时classpath中的某个库冲突了,通过以上方式应该能解决这个问题,解决了这个问题后就可以正常发起WEB服务运行我们的APP。
2.3 guava
geotrellis毕竟是一个大数据(主要是栅格)处理的工具,那么当然少不了数据,所以APP运行起来之后,开始导数据,然后就又蒙圈了,又会报一个方法找不到的错误。导数据的时候由于参数采用了json文件进行配置,所以geotrellis会进行json校验,就是这个时候出问题了,geotrellis采用了google开源的工具库com.google.guava,就是这个库由冲突了造成的,这个倒是可以用ShadeRule的方式解决,只需要在build.sbtz文件中添加如下代码:
assemblyShadeRules in assembly := {
Seq(
ShadeRule.rename(“com.google.common.**” -> “my.google.common.@1”)
.inLibrary(
“com.azavea.geotrellis” %% “geotrellis-cassandra” % gtVersion,
“com.github.fge” % “json-schema-validator” % “2.2.6”
).inAll
}
2.4 spark-core、hadoop-client
CDH毕竟是采用修改后的HADOOP以及SPARK,所以为了安全起见,需要将原始的库替换成CDH对应版本,具体为将二者的依赖改成如下方式:
resolvers += “cloudera” at “https://repository.cloudera.com/artifactory/cloudera-repos”
val sparkV = “1.6.0-cdh5.8.0”
“org.apache.spark” %% “spark-core” % sparkV % “provided”
“org.apache.hadoop” % “hadoop-client” % “2.7.1” % “provided”
通过以上方式可以加载CDH版本的HADOOP以及SPARK,并且添加”provided”可以使得我们的APP直接调用CDH提供的对应版本。
2.5 hdfs权限
这也是一个大坑,当解决了上面的问题之后满心欢喜以为就能进行数据处理了,谁知道程序死活就是不往下走,而且不报任何错误(不知道是不是我设置的有问题,当然刚开始也没看CDH运行的日志文件,不然应该也较快的解决了,日志文件在/var/log/accumulo中),反复检查Accumulo配置等等,均没有问题,最后使出了一个大招,程序加了个try catch,果然出现问题了,一看就是hdfs权限的问题。首先我装cloudera的时候选择的是多用户模式,我猜测出现权限问题可能也跟多用户有关系。反复实验了各种方式都没能解决问题,最终我解决权限问题的方式是将hdfs的umask设置为0000,这样使得一个用户创建的文件以及文件夹可以被其他用户操作,通过这种方式解决了问题,最终顺利将数据导入到Accumulo种。
三、总结
本文为大家介绍了我在将geotrellis程序部署到CDH中遇到的几个问题及解决方案,看似简单的几句话的事情,其实足足折腾了好几天。而且每个人由于实际配置版本等不同,在部署的过程中可能会遇到这些问题,也可能会遇到新的问题。总之,只要你能够自己折腾那么一番不管结果如何,一定会在过程中学到很多东西。
geotrellis使用(二十五)将Geotrellis移植到spark2.0
目录
- 前言
- 升级spark到2.0
- 将geotrellis最新版部署到spark2.0(CDH)
- 总结
一、前言
事情总是变化这么快,前面刚写了一篇博客介绍如何将geotrellis移植导CDH中(见geotrellis使用(二十四)将Geotrellis移植到CDH中必须要填的若干个坑),刚各种折腾几天,就又跑不起来了,查找一番,发现是由于将geotrellis升级到最新版造成的,所以不得不赶紧再救火。原来是最新版以及以后的版本geotrellis都不再支持spark2.0以下版本,没办法只能升级了。本文为大家简单介绍如何在cloudera中将spark版本升级到2.0,以及在部署到spark2.0(CDH)中的一些问题及解决方案。
二、升级spark到2.0
2.1 将集群的JDK版本升级到1.8
最新版的geotrellis不再支持jdk1.8以下版本,所以需要将集群的运行jdk升级到1.8,就是要将cloudera的集群jdk升级到1.8。详情见http://bigdatafan.blogspot.jp/2016/05/upgrade-java-to-jdk-8-on-cloudera-cdh.html,文章里面写的很清楚,不再赘述。
2.2 将集群的spark版本升级到2.0
这里与其说是升级倒不如说是重新安装一套,cdh5.9以上版本可能才会支持spark2.0,目前只能是在cloudera中添加一个2.0的beta版。详情参考https://blog.cloudera.com/blog/2016/09/apache-spark-2-0-beta-now-available-for-cdh/,同样本文不再赘述。需要强调的是安装完后提交spark2.0的程序就需要改用spark2-submit。
三、将geotrellis最新版部署到spark2.0(CDH)
目前geotrellis最新版为1.0.0-40a2f7a,该版本相较以前有了较大的变化,并且使用了spark2.0之后性能确实有所提高。在升级过程中发现如下问题:
3.1 整体sbt依赖
依赖基本不变,需要变的地方为:geotrellis版本变为1.0.0-40a2f7a,spark的版本需要改为2.0.0,添加akka依赖,scalaVersion变为2.11.8(2.11以上版本)。
3.2 akka版本问题
在上一篇文章中讲到通过测试发现akka版本对程序运行没有影响,但是在2.0版需要将akka的版本降到2.4以下,否则启动会报错。
3.3 spray版本问题
上一篇文章中测试发现spray版本必须降到1.2.3,否则会报错,但是在2.0版这个问题又不存在了,直接使用最新版即可。
四、总结
本文简单为大家介绍了将geotrellis程序部署到spark2.0中遇到的几个问题及解决方案,其他不多说,如果有遇到相关问题的,欢迎交流、共同学习。
geotrellis使用(二十六)实现海量空间数据的搜索处理查看
目录
- 前言
- 前台实现
- 后台实现
- 总结
一、前言
看到这个题目有人肯定会说这有什么可写的,最简单的我只要用文件系统一个个查找、打开就可以实现,再高级一点我可以提取出所有数据的元数据,做个元数据管理系统就可以实现查找功能,有必要用geotrellis用分布式吗?这不是杀鸡用牛刀吗?理论上是这样的,但是要看我们考虑问题的尺度,如果你只是一些简单的数据用传统方法当然好,省事、省时、简单、速度快,但是当我们将数据的量放大到一个区域乃至全球的时候恐怕事情就不是那么简单了,比如我们有了全球Landsat数据,如何查看某一地区此数据的情况,传统方法可能要自己先计算出此区域的Landsat的带号,然后再找到此数据并打开之。如果觉得这海不麻烦,那么当用户需要考察Landsat的云量或者NDVI的时候是不是又要用户自己打开数据并使用Arcgis等自行计算?是不是很麻烦,而本文介绍的方法是只需要用户输入有关此点的信息(带号或者点位信息),系统能够自动呈现此区域的数据(或者云量、NDVI等结果),这样是不是逼格立马上去了呢?
二、前台实现
此功能的前台也不可谓不复杂,但是难不倒我这个全栈工程师(请忽略此话),费了半天劲,基本实现了前台的功能。总体就是一个搜索框加一个按钮,然后发送搜索关键词到后台,后台返回数据列表,前台逐条展示之,单机每条数据的时候在地图中(地图框架采用leaflet)呈现此数据的情况,类似Google、百度。这里面我主要介绍以下知识点。
2.1 在地图中添加、删除标记
要给用户呈现数据情况,最重要的就是数据的空间范围,简单的说就是将四个(或多个)顶点逐一连成线在地图中显示出来。leaflet可以简单的使用如下语句实现该功能:
geoJsonOverlay = L.geoJson(geoJson);
geoJsonOverlay.addTo(map);
其中map为L.map(‘map’)对象,geoJson就是想要添加的标记对象,此处用的是GeoJson,GeoJson简单来说就是将空间对象转成相应的json对象,便于交互、传输等。
再次查询或其他情形下可能又需要将上述的标记层去掉,这时候只需下述语句即可:
map.removeLayer(geoJsonOverlay);
2.2 空间数据的显示
当用户想要查看某个检索出来的数据情况的时候就需要将此数据显示到地图当中,后台暂且不表,如果用到瓦片技术那么显示在leaflet中的方式就是添加一层,同样移除数据就是删除该层。代码如下:
//add
WOLayer = new L.tileLayer(baseurl + ‘/{z}/{x}/{y}’, {
format: ‘image/png’,
transparent: true,
attribution: ‘SJZX’
});
WOLayer.addTo(map);
map.lc.addOverlay(WOLayer, “Landsat”);
//delete
map.lc.removeLayer(WOLayer);
map.removeLayer(WOLayer);
三、后台实现
后台牵涉到的东西较多,主要是数据检索、数据范围生成GeoJson、数据存放、数据处理、数据发送等。
3.1 数据检索
这块与传统方式相同,但是本文采用全文检索的方式,该内容涉及到的问题也比较多,会在后续另立新篇,详细介绍本系统全文检索以及空间检索的实现,总体上根据前台传入的关键词返回与之相关联的数据,相当于地理信息系统版的Google。
3.2 数据范围生成GeoJson
简单说来就是从元数据中读出数据的空间范围,将此范围生成GeoJson对象发送到前台。具体元数据信息可以通过上面的数据检索获取,此处假设已经取到了空间范围的WKT标记对象,剩下的工作就是将WKT转成GeoJson,代码如下:
import geotrellis.vector.io.json.Implicits._
val geom = WKT.read(wkt)
geom.toGeoJson
当然此处还需要考虑geometry对象的投影变换等问题,要考虑前台、后台以及数据等的投影方式,转换成自己需要的投影方式。
3.3 数据存放
这块是本系统的核心,面对如此大的数据量只有合理的数据存放方式才能实现快速响应。目前采用的方式是前面文章讲述过的将数据导入到Accumulo,这种方式的好处是请求数据快,但同时造成的一个问题是数据量大(相当于数据保存了2-3份,如果再考虑HDFS的备份特性,相当于6-9份),以上述Landsat为例,采用此种方式必须要将全球的Landsat数据都导入到Accumulo中,这个量是非常大的,如果有多套数据需要采用此种方式检索,那么这个数据量确实非常大,但是分布式框架本身就是为了解决大数据量的问题。目前也正在寻找折中的解决方案。
3.4 数据处理
比如Landsat数据我们可以实时计算用户查找区域的云量以及NDVI等并将之呈现给用户,这样用户能够对数据的质量有一个更加深刻的认识,而不需要用户再进行下载数据分析处理等。
3.5 数据发送
数据发送的目的是将上述处理好的数据或原始数据发送到前台,前台进行展示。此处需要注意的是要根据请求的范围对请求结果进行掩盖,因为用户感兴趣(查找)的是某一个或某几个数据,如果不加掩盖,前台获取到的仍然是全球的数据,这样就没有意义。单个瓦片的请求在前面的文章中已经讲过,这里重点讲一下掩盖操作。前台的区别就是在请求数据的时候要多发送一个请求范围,比如为用户检索数据时后台发送的数据空间范围GeoJson对象,后台首先根据请求的x、y、z取到对应的瓦片,然后判断此瓦片与GeoJson对象的空间关系,取出在范围内的数据,其他数据赋为无值,这样就可以得到掩盖后的瓦片,看似复杂其实Geotrellis已经为我们实现了该过程,只需要简单几行代码即可实现:
import geotrellis.vector.io.json.Implicits._
val extent = attributeStore.read[TileLayerMetadata[SpatialKey]](id, Fields.metadata).mapTransform(key)
val geom = geoJson.parseGeoJson[Geometry]
tile.mask(extent, geom)
其中attributeStore是Accumulo操作的实例,id为表示请求层的对象,key为表示请求瓦片的x、y,geoJson就是传入的空间范围对象,根据上述代码就能实现范围掩盖操作。
四、总结
本文简单为大家介绍了如何实现海量空间数据的搜索以及详情查看,有些部分会在后续详细介绍,本文仅为框架介绍。
geotrellis使用(二十七)栅格数据色彩渲染
目录
- 前言
- 复杂原因及思路分析
- 实现过程
- 总结
一、前言
今天我们来研究一下这个看似简单的问题,在地理信息系统中颜色渲染应当是最基本的操作和功能,比如我们将一幅Landsat数据拖拽到Arcgis或者QGis等软件中,软件会自动为我们呈现出漂亮的图案,一切看似来的那么容易,但是在分布式海量空间数据的情况下实现色彩渲染操作实在也是要了命的。今天我们就接着上一篇文章中的数据处理(权且将色彩渲染归结到数据处理中)来介绍一下如何在Geotrellis中为栅格数据渲染漂亮的色彩。
二、复杂原因及思路分析
普通地理信息系统处理的对象都是单幅图像,当我们打开单幅图像的时候程序很容易获取到关于此数据的数据,包括元数据信息、波段信息、值域范围等等,我理解的色彩渲染就是读出图像的值域范围将其分段对应到相应的色彩即可。而当我们采用分布式处理框架之后,面对的不再是单幅图像,而是一层或一种(Geotrellis中将存储在Accumulo中的数据按照导入名称进行分层管理),而其读取数据的时候也不再是读取整个数据,而是单一瓦片或者部分数据,面对这种方式我们就无法再简单的根据当前请求的数据值域来进行简单的对应。
这个问题上升到哲学就是局部与整体的关系,我们如何根据局部的信息来显示出整体一致的效果。比如我们请求了一个瓦片,我们不可能根据此瓦片的值域做颜色映射,此瓦片作为很小的局部必然不可能包含我们研究范围(整体)的所有信息,但只要我们将其类比到传统地理信息系统就为此问题找到了解决方案。
首先像传统地理信息系统读取整幅图像那样获取我们研究区域的信息,然后将请求的单一瓦片根据整体的信息做色彩映射,这样我们就能得到整体一致的色彩效果。
写到这里我突然有个思路,目前遥感影像匀光匀色是一个很复杂的过程,需要耗费大量的人力和时间也未必能得到理想的效果,我觉得此处可以借鉴上述整体与局部的关系,当我们研究清楚了整体(如全球)遥感影像数据的情况之后,将单幅影像作为局部向整体映射,这样应该就能得到整体一致的匀光匀色效果,此思路有待验证。
三、实现过程
实现过程只需要将上述思路转换成代码即可,首先读取整体(研究区域)信息,此研究区域我们以一个面状区域为例。
3.1 整体信息
简单的说就是将研究区域与数据整体做空间判断,取出研究范围内的数据,然后统计此范围内数据信息。实现代码如下:
val raster = reader.query[SpatialKey, Tile, TileLayerMetadata[SpatialKey]](layerId).where(Intersects(polygon)).result
raster.minMax
很简单的两行代码,其中reader是Accumulo层的读取对象,layerId表示请求层,polygon表示研究的范围,这样就能得到研究区域内值域的分布情况。
3.2 瓦片映射到整体
根据整体信息将值域内的数据值映射到颜色范围内,然后读取单一瓦片根据每个像素点的值选取对应的颜色即可,代码如下:
val cr = ColorRamp(startColor, endColor).stops(stops)
val cm = cr.toColorMap((startValue to endValue).toArray)
tile.renderPng(cm)
其中startColor表示起始颜色值,一般为白色,endColor表示终止颜色值,一般为黑色,stops表示要将此颜色区域分成多少区间,是为了让出来的色彩效果更加平滑,startValue和endValue就是上一步获取到整体的值域范围,tile为请求的瓦片,最终将获取到一幅渲染好的png,将其发送到前台显示即可。
四、总结
本文简单为大家介绍了如何实现栅格数据的色彩渲染,复杂的问题经过分析之后貌似也不是那么复杂,但是这些都要经过一步步探索、反复思索才能找到方案,所以作为一个程序员也不能仅仅关注代码,更应该多理理自己的思路,找到好的解决问题的方案。真的是一入地理信息系统深似海,一入大数据地理信息深似无底洞,牵涉到的东西以及需要学习的东西实在太多。无它法,唯有低着头,朝着目标步履维艰的前进。
![]()
![]()









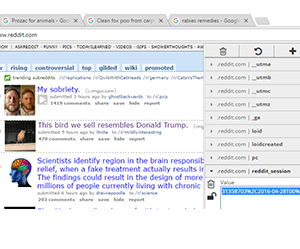



 Written by renowned data science experts Foster Provost and Tom Fawcett, Data Science for Business introduces the fundamental principles of data science, and walks you through the “data-analytic thinking” necessary for extracting useful knowledge and business value from the data you collect. This guide also helps you understand the many data-mining techniques in use today.
 Python for Data Analysis is concerned with the nuts and bolts of manipulating, processing, cleaning, and crunching data in Python. It is also a practical, modern introduction to scientific computing in Python, tailored for data-intensive applications. This is a book about the parts of the Python language and libraries you’ll need to effectively solve a broad set of data analysis problems. This book is not an exposition on analytical methods using Python as the implementation language.
 Data Science gets thrown around in the press like it’s magic. Major retailers are predicting everything from when their customers are pregnant to when they want a new pair of Chuck Taylors. It’s a brave new world where seemingly meaningless data can be transformed into valuable insight to drive smart business decisions.
 Storytelling with Data teaches you the fundamentals of data visualization and how to communicate effectively with data. You’ll discover the power of storytelling and the way to make data a pivotal point in your story. The lessons in this illuminative text are grounded in theory, but made accessible through numerous real-world examples—ready for immediate application to your next graph or presentation.
 With more than 200 practical recipes, this book helps you perform data analysis with R quickly and efficiently. The R language provides everything you need to do statistical work, but its structure can be difficult to master. This collection of concise, task-oriented recipes makes you productive with R immediately, with solutions ranging from basic tasks to input and output, general statistics, graphics, and linear regression.
 What exactly is data science? With this book, you’ll gain a clear understanding of this discipline for discovering natural laws in the structure of data. Along the way, you’ll learn how to use the versatile R programming language for data analysis.
 This practical guide provides more than 150 recipes to help you generate high-quality graphs quickly, without having to comb through all the details of R’s graphing systems. Each recipe tackles a specific problem with a solution you can apply to your own project, and includes a discussion of how and why the recipe works.
 How can you tap into the wealth of social web data to discover who’s making connections with whom, what they’re talking about, and where they’re located? With this expanded and thoroughly revised edition, you’ll learn how to acquire, analyze, and summarize data from all corners of the social web, including Facebook, Twitter, LinkedIn, Google+, GitHub, email, websites, and blogs.
 Learning Python language is very important for a data scientist. If you want to learn how to program, working with Python is an excellent way to start. This hands-on guide takes you through the language one step at a time, beginning with basic programming concepts before moving on to functions, recursion, data structures, and object-oriented design.
 Create and publish your own interactive data visualization projects on the Web—even if you have little or no experience with data visualization or web development. It’s easy and fun with this practical, hands-on introduction. Author Scott Murray teaches you the fundamental concepts and methods of D3, a JavaScript library that lets you express data visually in a web browser. Along the way, you’ll expand your web programming skills, using tools such as HTML and JavaScript.
 Data in all domains is getting bigger. How can you work with it efficiently? Recently updated for Spark 1.3, this book introduces Apache Spark, the open source cluster computing system that makes data analytics fast to write and fast to run. With Spark, you can tackle big datasets quickly through simple APIs in Python, Java, and Scala. This edition includes new information on Spark SQL, Spark Streaming, setup, and Maven coordinates.
 Now that people are aware that data can make the difference in an election or a business model, data science as an occupation is gaining ground. But how can you get started working in a wide-ranging, interdisciplinary field that’s so clouded in hype? This insightful book, based on Columbia University’s Introduction to Data Science class, tells you what you need to know.
 These days it seems like everyone is collecting data. But all of that data is just raw information — to make that information meaningful, it has to be organized, filtered, and analyzed. Anyone can apply data analysis tools and get results, but without the right approach those results may be useless.
 This book offers a highly accessible introduction to natural language processing, the field that supports a variety of language technologies, from predictive text and email filtering to automatic summarization and translation. With it, you’ll learn how to write Python programs that work with large collections of unstructured text. You’ll access richly annotated datasets using a comprehensive range of linguistic data structures, and you’ll understand the main algorithms for analyzing the content and structure of written communication.
 Learn web scraping and crawling techniques to access unlimited data from any web source in any format. With this practical guide, you’ll learn how to use Python scripts and web APIs to gather and process data from thousands—or even millions—of web pages at once.
 R in Action, Second Edition presents both the R language and the examples that make it so useful for business developers. Focusing on practical solutions, the book offers a crash course in statistics and covers elegant methods for dealing with messy and incomplete data that are difficult to analyze using traditional methods. You’ll also master R’s extensive graphical capabilities for exploring and presenting data visually. And this expanded second edition includes new chapters on time series analysis, cluster analysis, and classification methodologies, including decision trees, random forests, and support vector machines.
 As data science evolves to become a business necessity, the importance of assembling a strong and innovative data teams grows. In this in-depth report, data scientist DJ Patil explains the skills, perspectives, tools and processes that position data science teams for success.
 In this practical book, four Cloudera data scientists present a set of self-contained patterns for performing large-scale data analysis with Spark. The authors bring Spark, statistical methods, and real-world data sets together to teach you how to approach analytics problems by example.
 The financial industry has adopted Python at a tremendous rate recently, with some of the largest investment banks and hedge funds using it to build core trading and risk management systems. This hands-on guide helps both developers and quantitative analysts get started with Python, and guides you through the most important aspects of using Python for quantitative finance.
 If you know how to program with Python and also know a little about probability, you’re ready to tackle Bayesian statistics. With this book, you’ll learn how to solve statistical problems with Python code instead of mathematical notation, and use discrete probability distributions instead of continuous mathematics. Once you get the math out of the way, the Bayesian fundamentals will become clearer, and you’ll begin to apply these techniques to real-world problems.
 Succeeding with data isn’t just a matter of putting Hadoop in your machine room, or hiring some physicists with crazy math skills. It requires you to develop a data culture that involves people throughout the organization. In this O’Reilly report, DJ Patil and Hilary Mason outline the steps you need to take if your company is to be truly data-driven—including the questions you should ask and the methods you should adopt.
 The Data Science Handbook contains interviews with 25 of the world s best data scientists. We sat down with them, had in-depth conversations about their careers, personal stories, perspectives on data science and life advice. In The Data Science Handbook, you will find war stories from DJ Patil, US Chief Data Officer and one of the founders of the field. You ll learn industry veterans such as Kevin Novak and Riley Newman, who head the data science teams at Uber and Airbnb respectively.
 Bayesian methods of inference are deeply natural and extremely powerful. However, most discussions of Bayesian inference rely on intensely complex mathematical analyses and artificial examples, making it inaccessible to anyone without a strong mathematical background. Now, though, Cameron Davidson-Pilon introduces Bayesian inference from a computational perspective, bridging theory to practice–freeing you to get results using computing power.
 Machine learning has become an integral part of many commercial applications and research projects, but this field is not exclusive to large companies with extensive research teams. If you use Python, even as a beginner, this book will teach you practical ways to build your own machine learning solutions. With all the data available today, machine learning applications are limited only by your imagination.
 Oehlert’s text is suitable for either a service course for non-statistics graduate students or for statistics majors. Unlike most texts for the one-term grad/upper level course on experimental design, Oehlert’s new book offers a superb balance of both analysis and design.
 Written by leading authorities in database and Web technologies, this book is essential reading for students and practitioners alike. The popularity of the Web and Internet commerce provides many extremely large datasets from which information can be gleaned by data mining. This book focuses on practical algorithms that have been used to solve key problems in data mining and can be applied successfully to even the largest datasets.
 Looking for one central source where you can learn key findings on machine learning? Deep Learning: A Practitioner’s Approach provides developers and data scientists with the most practical information available on the subject, including deep learning theory, best practices, and use cases.
 D3 Tips and Tricks is a book written to help those who may be unfamiliar with JavaScript or web page creation get started turning information into visualization. Data is the new medium of choice for telling a story or presenting compelling information on the Internet and d3.js is an extraordinary framework for presentation of data on a web page.
 This book describes, simply and in general terms, the process of analyzing data. The authors have extensive experience both managing data analysts and conducting their own data analyses, and have carefully observed what produces coherent results and what fails to produce useful insights into data. This book is a distillation of their experience in a format that is applicable to both practitioners and managers in data science.




 The interesting intersection of IoT and geospatial Big Data is going to be the ground truth of sensors coupled with the near-real-time modelling of additional visible spectrum data from remote sensing. “In other words, from micro to macro tied together to describe the world in ways never before possible,” feels Kodanaz.